Reason to trust

How Our News is Made
Strict editorial policy that focuses on accuracy, relevance, and impartiality
Ad discliamer
Morbi pretium leo et nisl aliquam mollis. Quisque arcu lorem, ultricies quis pellentesque nec, ullamcorper eu odio.
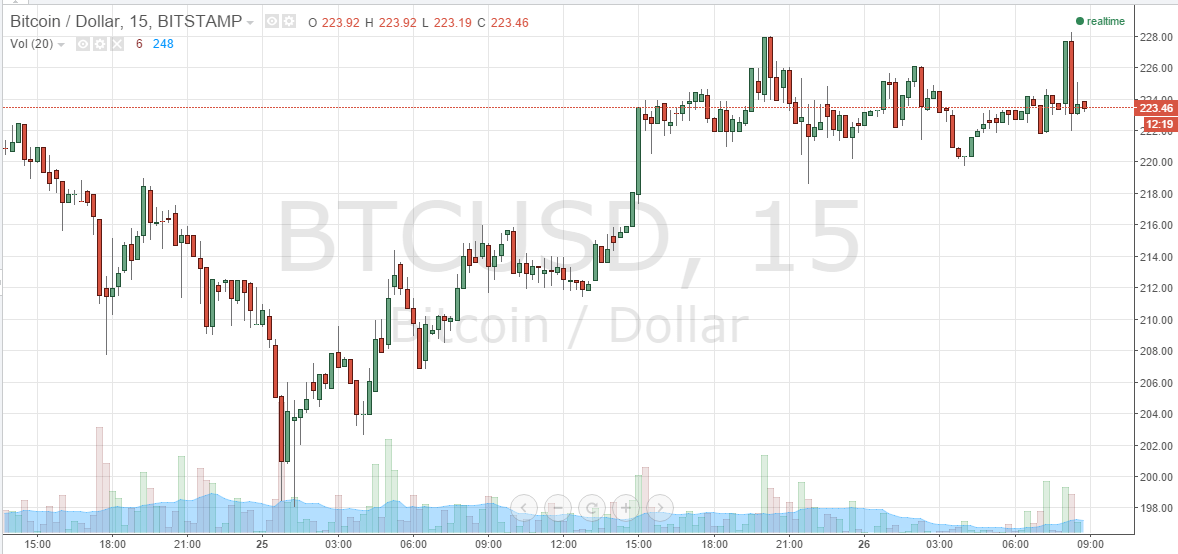
Action overnight on Tuesday has sparked something of a recovery in the bitcoin price, despite us breaking the 200 support level earlier in the week. With a nice break to the upside yesterday afternoon, we have managed to hold above 220 victory much the entire night – which bodes well for the fresh European session today. With this said, things are still pretty uncertain out there, and equities markets remain volatile on the back of what’s happening in China. As a result, we must also bear in mind that a downside play could be on the cards. So, with this said, what are the levels we are keeping an eye on today in the bitcoin price, and where can we look to get in and out of the market according to our intraday breakout strategy? Take a quick look at the chart.

As you see, yesterday afternoon around 3 PM GMT we broke through in term resistance at 220 flat and reached overnight highs of just ahead of 227.50. We then ranged throughout the Asian session and, about half an hour ago, once again reached 227.5 only to reverse and trade mid-range at the moment. The levels were keeping an eye on today are those aforementioned – in term support to 20 flat and in term resistance at 227.5.
Will initially look for a break above in term resistance to validate a medium-term upside target of 231 flat. On this trade, a stop loss somewhere around 225 flat should help to maintain a positive risk reward profile.
Looking the other way, if we break back below in term support at 220 flat, and get a close below this level on an intraday basis, would put us short towards a slightly longer-term target of 215 flat. A mid-range stop loss somewhere around 223 will keep things attractive from a risk management perspective.
Charts courtesy of Trading View


What is considered “the intraday chart”? What time period does it cover?