Reason to trust

How Our News is Made
Strict editorial policy that focuses on accuracy, relevance, and impartiality
Ad discliamer
Morbi pretium leo et nisl aliquam mollis. Quisque arcu lorem, ultricies quis pellentesque nec, ullamcorper eu odio.
Bitcoin Price Key Highlights
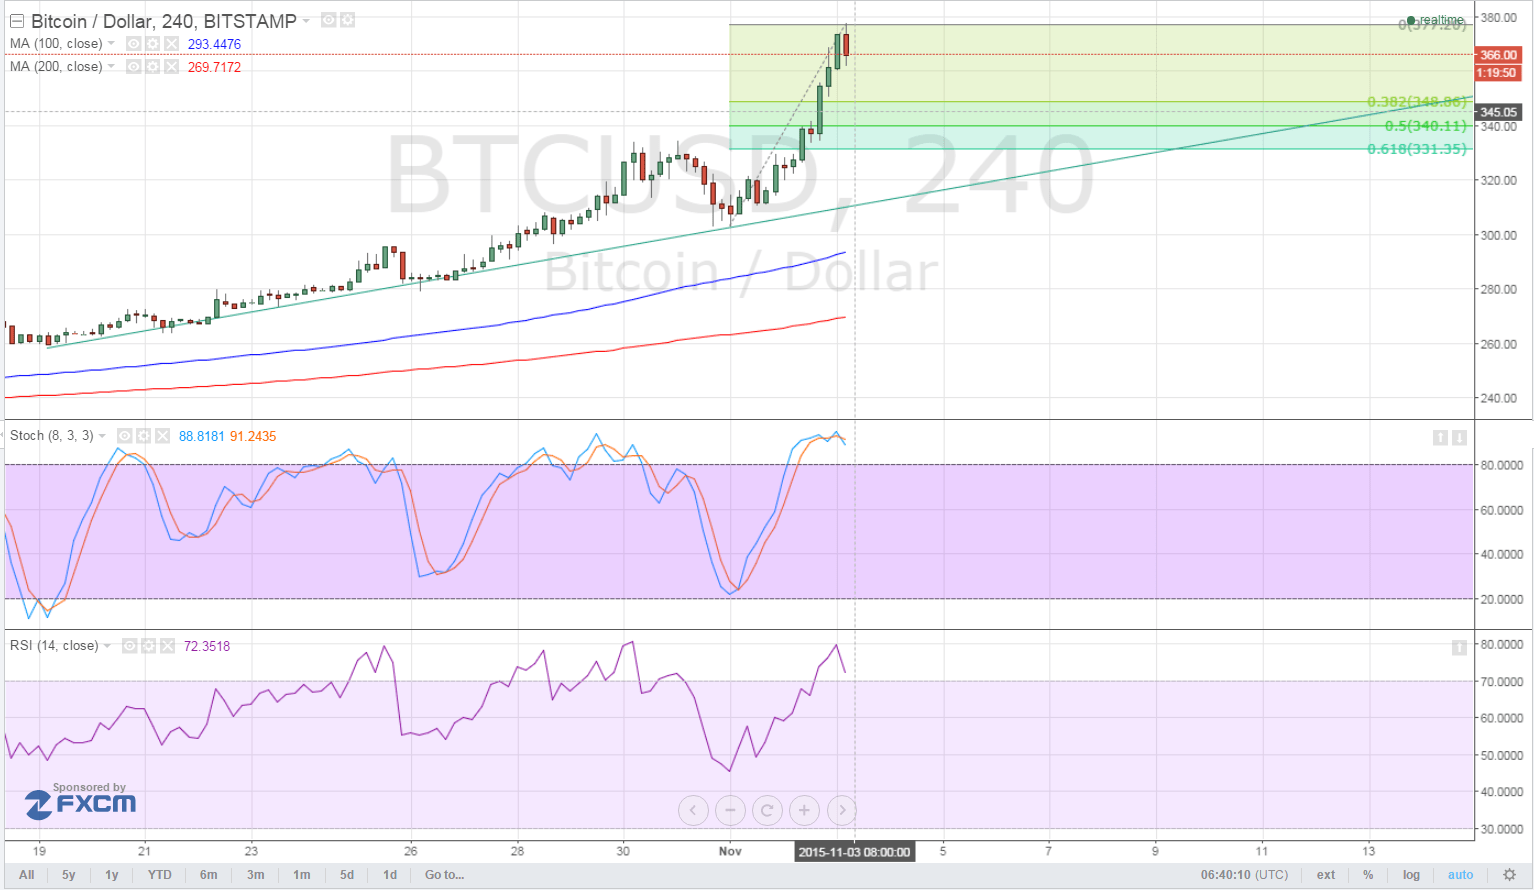
- Bitcoin price achieved yet another new high, surging past the $350 minor psychological barrier onto a peak of $378 so far.
- This strong rally could inspire profit-taking activity towards the end of the week, as traders reduce risk ahead of top-tier U.S. data releases.
Bitcoin price has been on a very strong uptrend but a large correction might be possible, offering the opportunity to catch the rally at a better price.
Support at Trend Line and Fibs
In the event of a large pullback, bitcoin price could still draw support around the Fibonacci retracement levels and the rising trend line visible on the 1-hour chart. This is around the $330 level, which also coincides with a short-term area of interest.

The 100 SMA is above the 200 SMA, indicating that the long-term climb is set to carry on. However, both stochastic and RSI are reflecting overbought conditions, which means that a selloff is bound to take place sooner or later.
A shallow pullback could lead to a bounce off the 38.2% Fib near $350 then a move back to the previous highs and beyond. Bitcoin price is already nearing the $400 level, which might also serve as a potential take profit point.
Intraday support level – $350
Intraday resistance level – $400
Charts from TradingView


hahahahaha. have you met bitcoin? 😉
Sarah you have been promising a pull back for weeks now. Keep flooging that horse!
I follow the news on Bitcoin and these articles are the most ridiculous things ever. I think the issue is you are trying to apply science/mathematics to a process that is wholly social.
I value information like; “A wider adoption and use of Bitcoin is pushing the price up” not “I have drawn some lines based on the past price and now the future price may be the same, or actually may be different”
Chinese trying to get money out of their oppressive country do not care about technical trends.