Reason to trust

How Our News is Made
Strict editorial policy that focuses on accuracy, relevance, and impartiality
Ad discliamer
Morbi pretium leo et nisl aliquam mollis. Quisque arcu lorem, ultricies quis pellentesque nec, ullamcorper eu odio.
Bitcoin Price Key Highlights
- Bitcoin price has gradually been trending higher but it looks like the rally is starting to lose steam
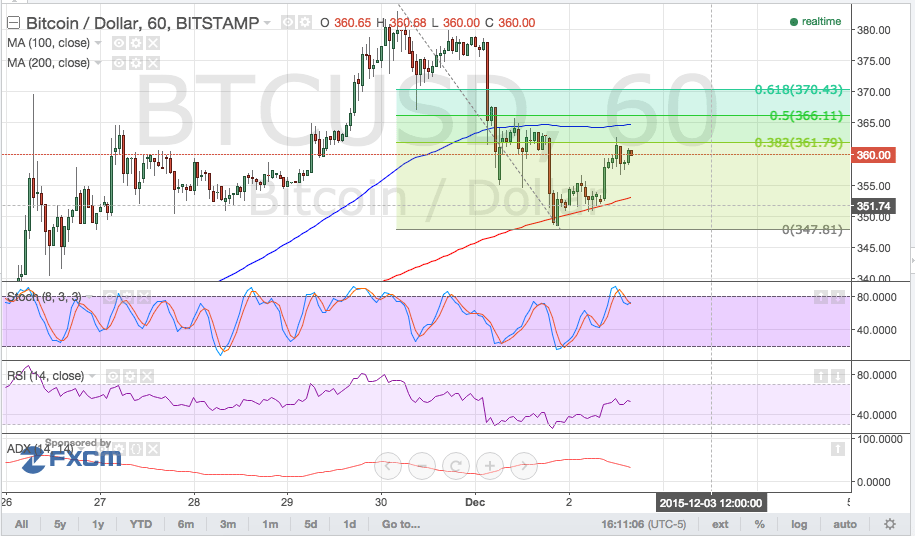
- Price might be forming a head and shoulders pattern on its 1-hour time frame, as the recent bounce off the Fib levels barely gained traction.
Bitcoin price could be due for another selloff if the reversal formation is completed and a downside break of the neckline is seen.
Short-Term Area of Interest
Using the Fib tool on the latest down move shows that the 50% level lines up with an area of interest around $365. This also coincides with the 100 SMA, which might hold as a dynamic resistance level.
If so, bitcoin price could go on to form the right shoulder of the chart pattern, indicating that a reversal might be brewing. The neckline is located at the $350 level so a break below this support area could be enough to confirm the potential downtrend.
For now, the 100 SMA is above the 200 SMA so the path of least resistance is still to the upside. A move past the highest Fib at $370 could show that the longer-term uptrend might prevail and that bitcoin price is set to test the previous highs at $380 or possibly move beyond it.

Stochastic is indicating overbought conditions, though, and is turning lower to indicate a return in selling pressure. In fact, a bearish divergence can be seen since price made lower highs while stochastic made higher highs in November 30 to today.
Meanwhile, RSI is on the move up so there might still be enough buying pressure left for further bitcoin price gains. The average directional index is treading around the 50 level but is starting to turn lower, possibly indicating a return in ranging market conditions.
Intraday support level – $340
Intraday resistance level – $365
Charts from Bitstamp, courtesy of TradingView


Hello sarah
I love your analyzes. They are just great work!
When will there come a new analyze for ethereum?
Thanks for the thumbs up – we’ll try and get 1 out for you tomorrow 🙂