Reason to trust

How Our News is Made
Strict editorial policy that focuses on accuracy, relevance, and impartiality
Ad discliamer
Morbi pretium leo et nisl aliquam mollis. Quisque arcu lorem, ultricies quis pellentesque nec, ullamcorper eu odio.
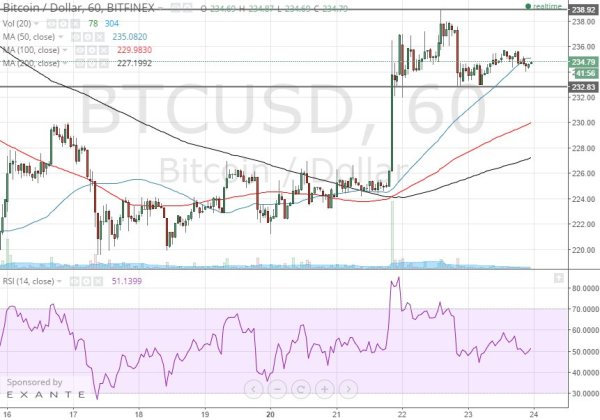
Bitcoin has stalled after a rally to 238/239 during the April 22 session. At the start of the April 23rd session, price retreated but held above 232. So far in the 1H chart, the market is still bullish in the short-term.
Bitcoin (BTCUSD) 1H Chart April 24

(click to enlarge)
As we start the April 24th session, we can see that price is still for the most part above the 200-, 100-, and 50-hour simple moving averages (SMAs) which are sloping up and in bullish alignment. The 1H RSi has pushed above 80 and held above 40, which shows maintenance of the bullish momentum. btcusd during most of the April 23rd session was in a slow drift slightly higher, but there’s no “energy” in this session’s price action. This lack of momentum favors further near-term bearish correction starting the April 24 session. If this occurs, there is still room to fall within the bullish scenario. We should expect support around 230. At 230, btcusd would have completed an ABC correction, and price would be testing a previous resistance pivot as well as the 100-hour SMA.
Now, if price falls below 225, we should consider the failed bullish scenario, which translates to a bearish outlook, with the 220 support pivot in sight first. Then, if price holds under 230, the bearish outlook would hold more weight, and the 216-217 April low would be in sight.
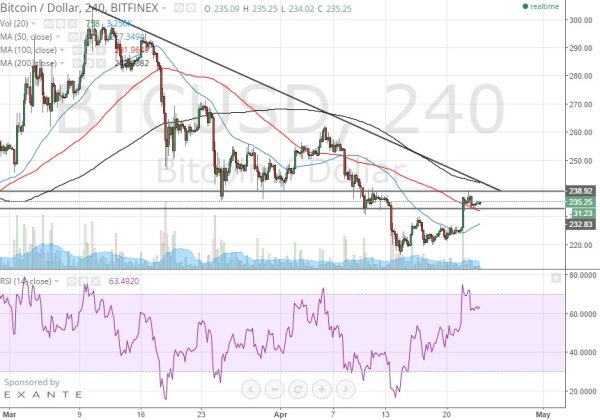
Bitcoin (BTCUSD) 4H Chart April 24

(click to enlarge)
While the momentum and bias in the near-term, 1H chart appears bullish, the 4H chart shows a bearish-neutral market, with emphasis on the bearish component, because the prevailing downtrend is still intact. The momentum has flattened as the RSI rose above 70 and bias is not as bearish as price crossed above the 100-, and 50-period SMA. However, to truly open up a bullish outlook, btcusd needs to cross above at least 243, where a falling trendline and the 200-period SMA resistance.
Previous Post by Author: Bitcoin Price Technical Analysis for 23/4/2015 – Pullback Watch


