Reason to trust
How Our News is Made
Strict editorial policy that focuses on accuracy, relevance, and impartiality
Ad discliamer
Morbi pretium leo et nisl aliquam mollis. Quisque arcu lorem, ultricies quis pellentesque nec, ullamcorper eu odio.
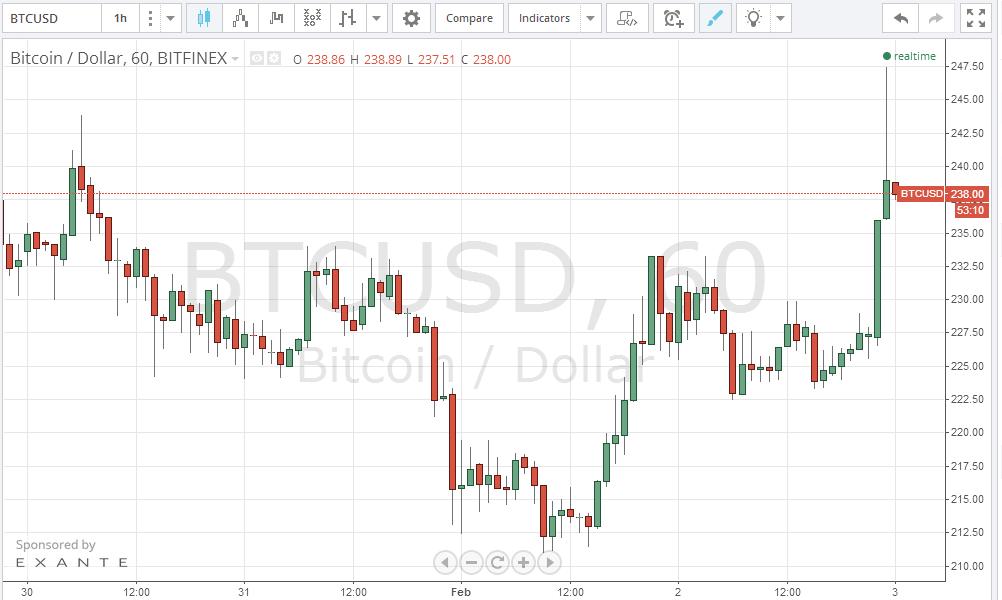
Bitcoin price resumed increasing today, reaching a high of $247 as the market’s trading volume is higher than yesterday’s. As the bullish wave is building up, we can soon see the price heading up to $300 as soon as the $256 resistance level is broken.
By examining the 1 hour Bitfinex (BTC/USD) charts from tradingview.com (look at the below chart), we can see that today’s trading has led to the formation of 7 successive green bullish candles, which is a sign denoting that the bullish wave has the strength to continue. We can notice that today’s bullish rally occurred at approximately the same time of yesterday’s bullish rally between 16:00 and 21:00 GMT which somehow coincides with market close in the Western world. Accordingly, it seems that we are going to see this pattern repeatedly during the following days; a few-hour bullish wave followed by a longer period of slow downward price correction.
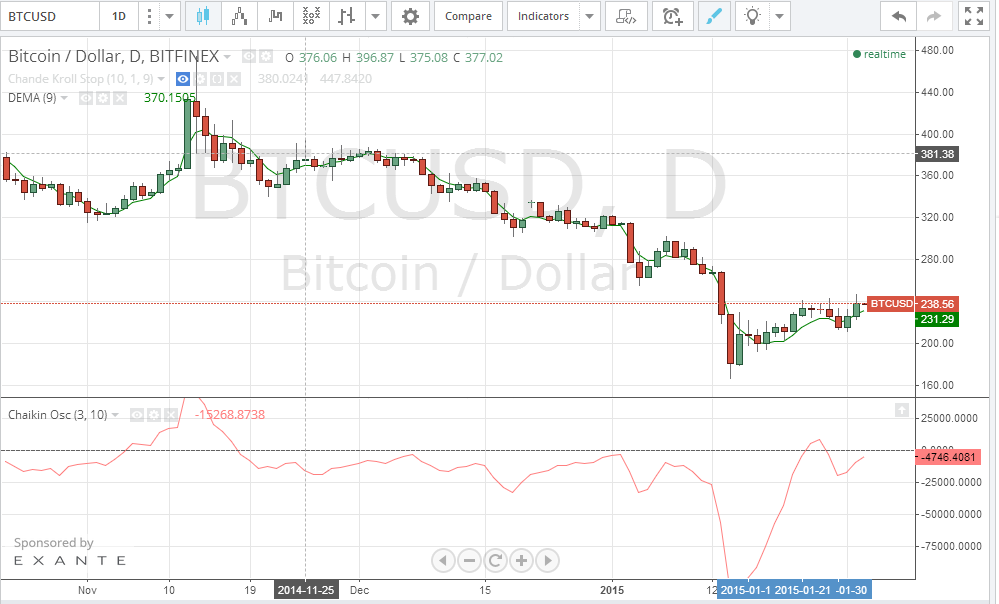
According to our previous analyses, it is clear how we can see the bitcoin price advancing to $300 as soon as the $256 resistance level is broken. We will use the Chaikin Oscillator to anticipate a growing bullish momentum by measuring the difference between the Accumulation Distribution Line of the 3 day EMA and the Accumulation Distribution Line of the 10 day EMA. By calculating the (3, 10) Chaikin Oscillator for the 1 day Bitfinex (BTC/USD) charts (look at the below chart), we can notice that the oscillator’s value is in the negative territory; However, the oscillator’s curve is sloping upwards and is likely to cross over to the positive territory soon. A positive Chaikin Oscillator denotes a prevailing buying market power for the bitcoin price market.
Conclusion:
Bitcoin price started a new bullish wave. A further continuation of the current buying power of the market can push the price up to $300 soon.
Charts: Bitfinex.


“According to our previous analyses, it is clear how we can see the bitcoin price advancing to $300 as soon as the $256 resistance level is broken.”
Well..sure. it is clear how YOU could see that. But no one else does. And you have been wrong 99.99999% of the time.
Just like cryptocooinnews…everything this moron Tamar says is EXACTLY the opposite of what happens.
Climbing up? And almost immediately after this is posted, it falls close to 10%.
And yet Tamar still makes these silly predictions, ignoring his 0.003% success rate of the fact that he is seen as a huge joke.
Well, here on the 8th the going price has stayed around $222USD. Were we given any time frame for that 256 level to be touched?