Reason to trust

How Our News is Made
Strict editorial policy that focuses on accuracy, relevance, and impartiality
Ad discliamer
Morbi pretium leo et nisl aliquam mollis. Quisque arcu lorem, ultricies quis pellentesque nec, ullamcorper eu odio.
Bitcoin Price Key Highlights
- Bitcoin price has been trending higher on the short-term time frames, bouncing off the trend line support as predicted in the previous article.
- From there, price went on to test the next resistance near $450 before showing signs of a pullback.
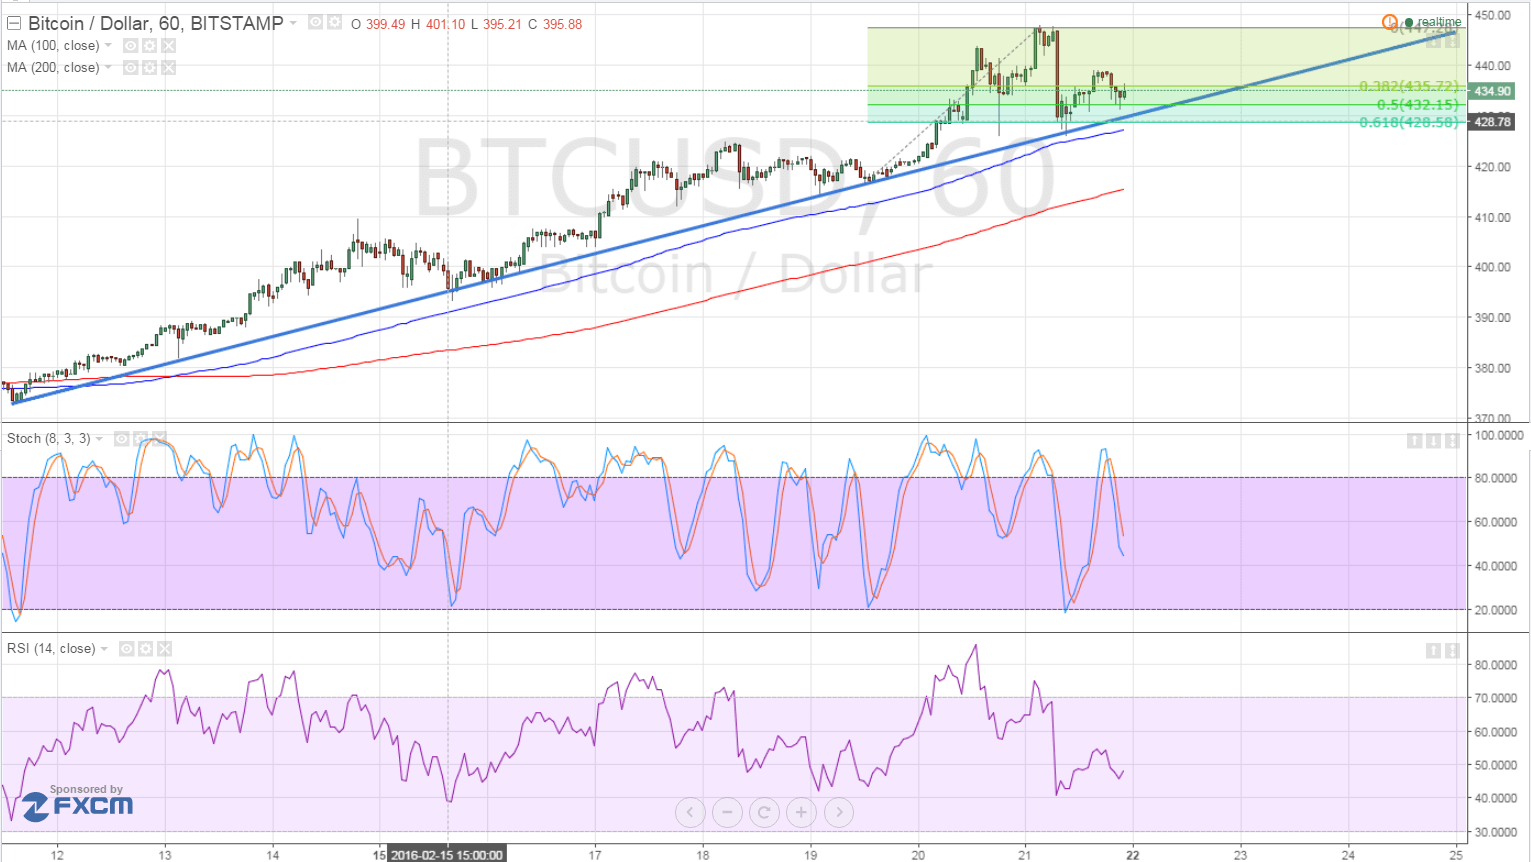
- Using the Fibonacci retracement tool on the latest swing high and low shows the potential support areas in this latest corrective wave.
Bitcoin price is once again testing the rising trend line support and might be due for another bounce to its previous highs and beyond.
Nearby Support Zones
Bitcoin price already bounced off the 61.8% Fibonacci retracement level at $428.58 and appears ready to climb to the swing high at $447.94. However, buyers still seem hesitant and are still waiting for more bulls to join the fold.
For now, price is stalling at the 50% Fib at $432.15 and might need another quick test of the trend line, which lines up with the 100 SMA. Speaking of the moving averages, the short-term 100 SMA is still above the longer-term 200 SMA so the uptrend could carry on.
In addition, the moving averages are edging farther apart, reflecting a buildup in buying pressure. In that case, price could have enough momentum to break past the $450 area and zoom up to the next long-term resistance at $465 then to $500.

Stochastic is heading down, however, which suggests that sellers are in control of bitcoin price action for now. RSI is also pointing south but is approaching the oversold levels. Once these oscillators start turning higher, bitcoin price could follow suit.
Market Events
The US dollar has been weakening against its higher-yielding peers these days as global economic slowdown concerns have been fading. However, a quick bout of profit-taking on Friday may have been responsible for that sharp drop in bitcoin, triggering another pullback to the trend line.
Data from the US economy also came in stronger than expected on Friday, as the headline CPI posted a flat reading instead of the estimated 0.1% decline while the core figure showed a stronger than expected 0.3% gain versus the projected 0.2% uptick. The medium-tier US flash manufacturing PMI is due today.
There are no major reports lined up from the US economy this week, which suggests that bitcoin price action could mostly be driven by risk sentiment. Recently, headlines about oil prices and a potential Brexit have been influencing risk flows.
So far, energy officials have been unable to come up with a deal to freeze production, especially since an Iranian official confirmed that they had been able to boost output levels by 500,000 barrels per day as promised after the Western sanctions were lifted earlier this year.
More reports on additional meetings to be held this week could continue to keep hopes up for a price bounce, allowing bitcoin price to hold on to its gains as well. On the other hand, lower odds of a production cap could force commodities and cryptocurrencies to retreat.
Intraday support level – $430
Intraday resistance level – $450
Technical Indicators Settings:
- 100 SMA and 200 SMA
- RSI (14)
- Stochastic (8, 3, 3)
Charts from Bitstamp, courtesy of TradingView


