Reason to trust

How Our News is Made
Strict editorial policy that focuses on accuracy, relevance, and impartiality
Ad discliamer
Morbi pretium leo et nisl aliquam mollis. Quisque arcu lorem, ultricies quis pellentesque nec, ullamcorper eu odio.
Bitcoin Price Key Highlights
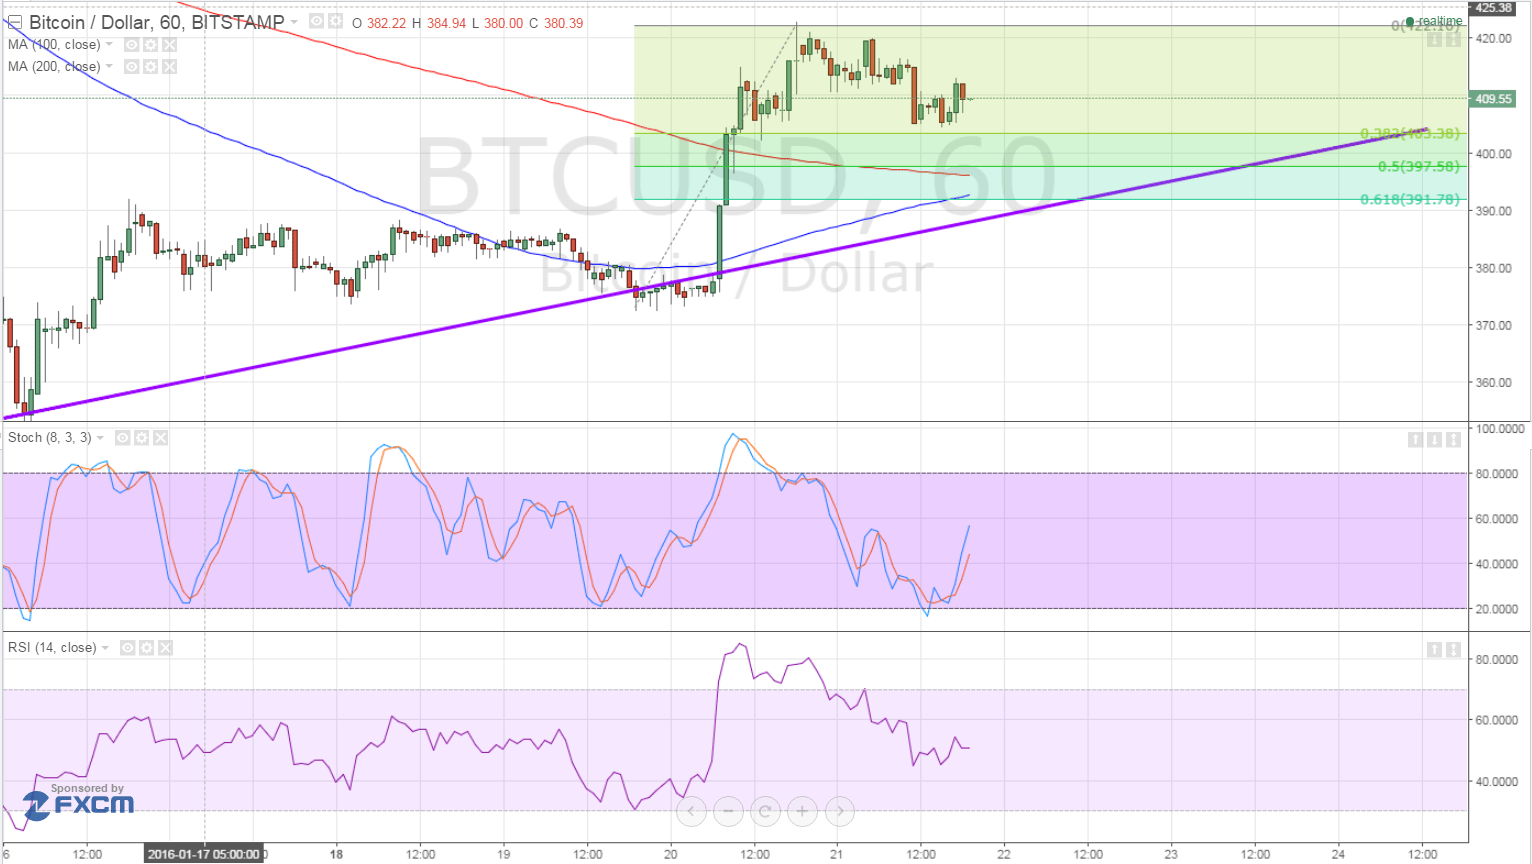
- Bitcoin price appears to be starting a new trend on its short-term time frames, as an ascending trend line can be drawn to connect the recent lows of price action.
- Technical indicators are also hinting at a start of a short-term uptrend, with the moving averages looking prime for an upward crossover.
- Using the Fibonacci retracement tool on the latest swing high and low reveals the potential support zones.
Bitcoin price could be starting a new uptrend but it needs to find support at the nearby Fib levels before confirming this climb.
Short-Term Support Areas
As you can see from the chart below, the 50%-61.8% Fibonacci retracement levels are closest in line to the rising trend line around the $390-400 bitcoin price levels. This is also near the moving averages, which tend to act as dynamic inflection points.
The moving averages are edging closer together, with the 100 SMA looking ready to make an upward crossover to indicate that the path of least resistance is to the upside. In that case, bitcoin price could bounce up to the latest highs around $420 or break above that.

Stochastic already reached the oversold area and climbed higher, indicating that bullish pressure is taking hold. However, RSI is still heading south, which means that there’s still some selling momentum left. This confirms that bitcoin price is in correction mode and might need to keep pulling back to encourage more buyers to hop in at bargain levels.
Market Factors
Financial markets were treated to more volatility yesterday after the European Central Bank decided to keep monetary policy unchanged but hinted of additional easing in March. In ECB Governor Draghi’s press conference, he stressed that the central bank has enough monetary policy measures to implement if the economic situation worsens.
This was welcomed with risk-on flows, supporting higher-yielding and riskier assets such as commodities and bitcoin. Oil prices also drew support from an OPEC report indicating lower oil production forecasts for nations not in the oil cartel.
On the other hand, the US dollar was a tad weaker since data came in mixed, with a larger than expected gain in initial jobless claims and an improvement in the Philly Fed index.
So far, risk appetite appears to be driving market flows, which is usually positive for bitcoin price. It also helped that renowned investor George Soros pointed out that the US central bank is less likely to hike interest rates again in March or even for the rest of the year, given the ongoing challenges facing the global economy.
If bulls are eager to push bitcoin price higher, a shallow retracement to the 38.2% Fib at the $405 area could be possible before the cryptocurrency regains ground quickly. In fact, bitcoin price also appears to have formed a bullish flag continuation pattern, with an upside breakout past the $410 area potentially serving as an early signal that the rally is resuming.
Intraday support level – $400
Intraday resistance level – $420
Technical Indicators Settings:
- 100 SMA and 200 SMA
- RSI (14)
- Stochastic (8, 3, 3)
Charts from Bitstamp, courtesy of TradingView


