Reason to trust
How Our News is Made
Strict editorial policy that focuses on accuracy, relevance, and impartiality
Ad discliamer
Morbi pretium leo et nisl aliquam mollis. Quisque arcu lorem, ultricies quis pellentesque nec, ullamcorper eu odio.
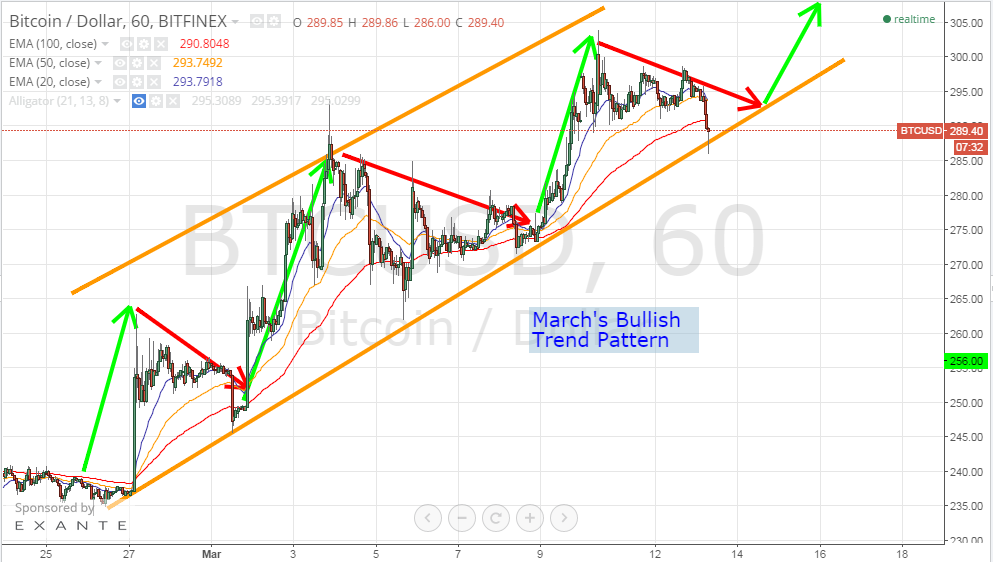
Bitcoin price rose to print a high of around $298 yesterday, before declining to around $288, which touches the rising support level we spotted on Wednesday’s analysis, earlier today. It seems like we are witnessing a “whiplash” downwards phase that proceeds a forwards phase that will lead to a breakthrough the $300 resistance level.
By studying the 1 hour Bitfinex (BTC/USD) chart from tradingview.com and plotting the 20, 50 and 100 period EMAs accordingly (look at the below chart), we can conclude the following:
- Since the beginning of March’s bullish trend, bitcoin price has been increasing along the orange trend lines on the below chart; it rises then drops to touch the rising support level before rising again.
- At the time of writing of this analysis, bitcoin price declined to touch the new support level, which is expected to reverse the downwards price correction movement as occurred on 3 occasions since the beginning of the new bullish wave. The upcoming upwards wave will probably push the price to test the $300 resistance level within the next 12 to 24 hours.
- Bitcoin price falls below the 20, 50 and 100 hour EMAs right before the downwards price correction wave starts. This was evident on 3 occasions since the beginning of March.
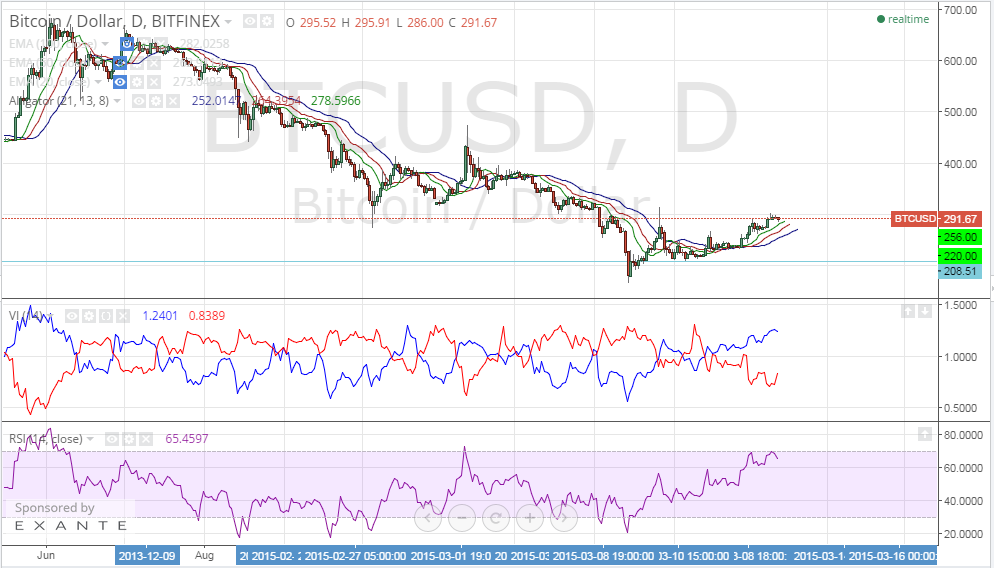
By studying the 1 day Bitfinex (BTC/USD) chart from tradingview.com and plotting the William’s Alligator indicator, RSI and Vortex Indicator (VI) accordingly (look at the below chart), we can notice the following:
- The SMAs of the William’s Alligator indicator show a perfect bullish alignment, so we expect the bullish wave to continue on pushing bitcoin price to higher levels.
- The VI is signaling continuation of the bullish wave as the blue uptrend line is above the red downtrend line and the gap between both is increasing.
- The RSI is around 64 at the moment. A rise above 70 can be a warning signal that flags stoppage of the bullish wave.
Conclusion:
Bitcoin price dropped to around $288 earlier today as the market was attempting to correct it. Our technical analysis predicts a rise in bitcoin price so that we can see the $300 resistance level retested within the next 24 hours or so.
Charts from bitfinex


Thank you Dr, saved me some time this morning 🙂
As always, I sincerely appreciate your analysis… and I am in complete agreement.
Doc quit with the self medicating already!