Reason to trust
How Our News is Made
Strict editorial policy that focuses on accuracy, relevance, and impartiality
Ad discliamer
Morbi pretium leo et nisl aliquam mollis. Quisque arcu lorem, ultricies quis pellentesque nec, ullamcorper eu odio.
Bitcoin price continued rising yesterday from a low of $235.86 up to record a high of around $244. The new uptrend is steady and continued to push the price to higher levels earlier today reaching $244.4 at the time of writing of this analysis.
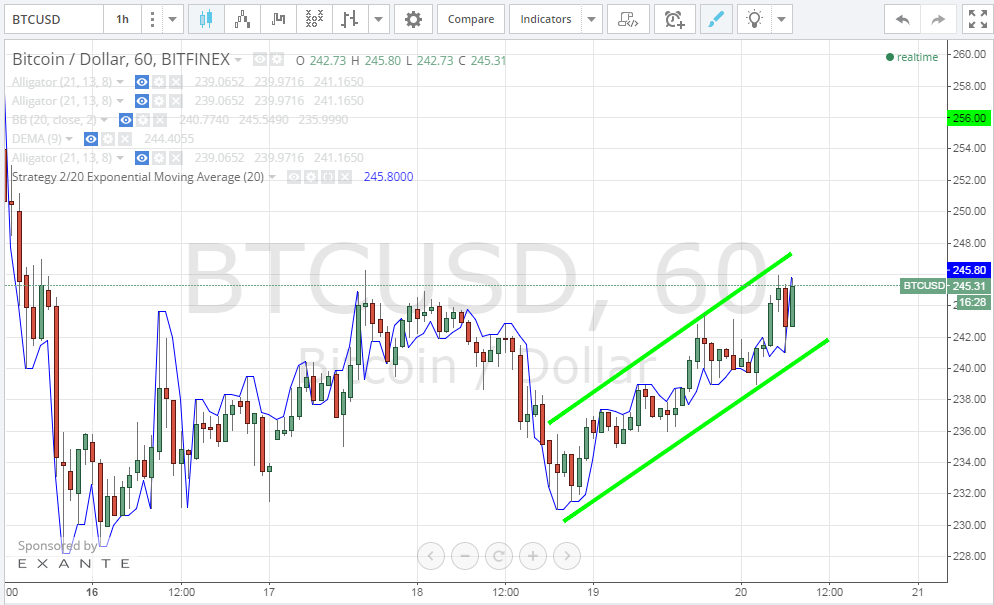
By studying the 1 hour Bitfinex (BTC/USD) chart from tradingview.com and plotting the 20 hour EMA (look at the below chart), we can notice the following:
- The bullish wave that started on the 18th of January has gained strength during yesterday’s later trading sessions, as shown by 2 bullish rallies, each consisting of 4 bullish candlesticks, on the 1 hour chart.
- During most of yesterday’s trading sessions, bitcoin price was trading above the 20 hour EMA, so it is likely to see the bullish wave push the price towards the $256 resistance level within the next 24 hours, provided that the tempo of this uptrend remains unchanged.
- At the time of writing of this analysis, bitcoin price is approaching the $246 level which resisted further rise on the 17th of February, so if the bullish wave succeeds in pushing the price above $246, it will face no considerable resistance along the way to the $256 resistance level.
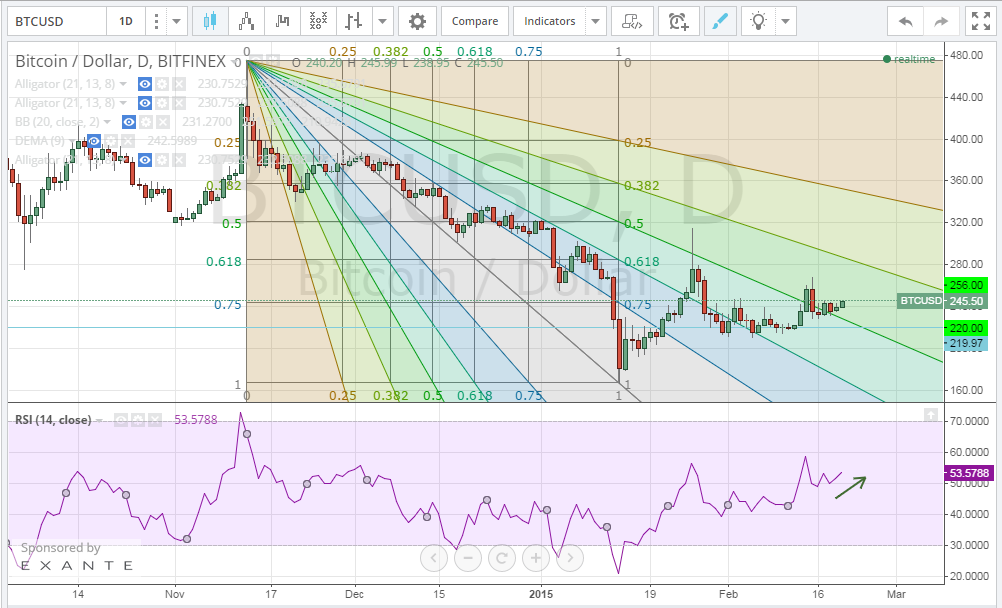
By studying the 1 day Bitfinex (BTC/USD) charts from tradingview.com, calculating the RSI and plotting the Fibonacci retracement fan across a trend line that extends between the high reached on the 13th of November ($475.31) and the low reached on the 14th of January ($167.02), we can conclude the following:
- Bitcoin price has now risen above the 50% Fibonacci retracement fan level, so if we can see it exceed $246 soon, it will face resistance at the $256 and $280 respectively, before reaching the $300 resistance level.
- The RSI is now sloping in an upwards direction that parallels the current 1 day (BTC/USD) chart. The value of the RSI is now around 53, so it seems that the bullish wave will continue on to push the price to higher levels; however, whenever its value rises to 70, it is likely to see the bullish wave slow down or even reverse.
Conclusion:
Bitcoin price is continuing to rise and is now about to break through the $246 level. As steadily as the current bullish waves seems to be, we will probably see bitcoin price approaching the $256 resistance level soon.
Charts from Bitfinex


How much do you think the auctions coming up will affect the price? After each previous auction there was a big sell off and drop right after. Do you see the same happening?