Reason to trust
How Our News is Made
Strict editorial policy that focuses on accuracy, relevance, and impartiality
Ad discliamer
Morbi pretium leo et nisl aliquam mollis. Quisque arcu lorem, ultricies quis pellentesque nec, ullamcorper eu odio.
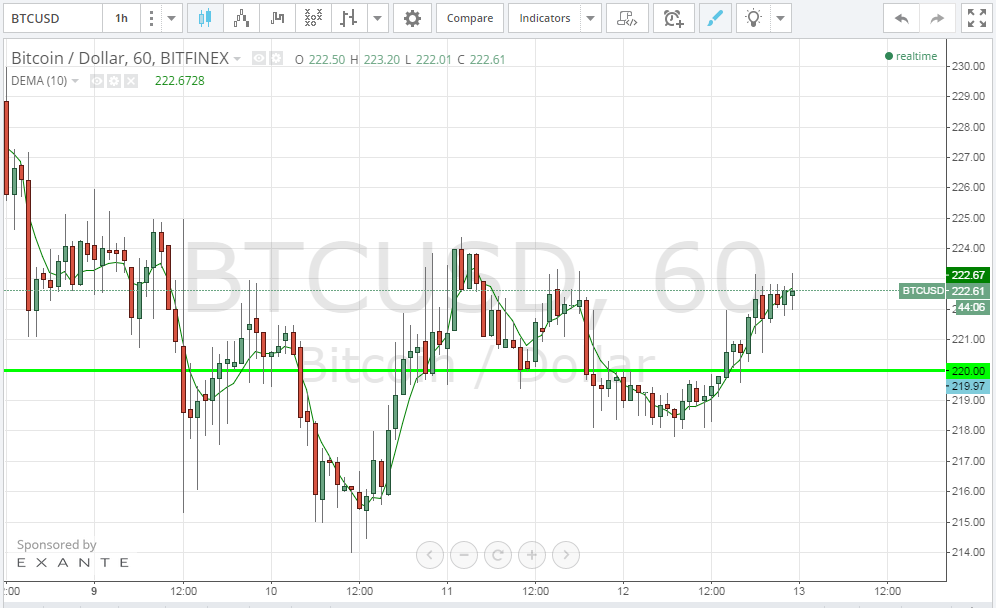
During most of today’s trading session, bitcoin price has been rising. Bitcoin price is trading over $222 at the time of the writing of this analysis, and is expected to rise even more.
By studying the 1 hour Bitfinex (BTC/USD) charts from tradingview.com, we can notice that bitcoin price started the day by trading around $219, igniting another overshoot below the $220 support level which was later on corrected, as we predicted yesterday., The price rose up to score a high of $23.06 later on. As the price has just risen above $220, the probability of a further rise remains high, especially since the price has been moving above the 10 day EMA during many of today’s trading sessions. In my opinion, if bitcoin price rises above $225 during the next few hours, we can see it reach the $256 resistance level during another 2-4 hours.
By studying the 4 hour Bitfinex (BTC/USD) chart from tradingview.com and plotting the William’s Alligator indicator and the Vortex Indicator (VI), we can notice the following:
- The alignment of the VI trend lines is rather perfect for an upcoming bullish rally; the positive blue trend line has crossed above the negative red trend line and the gap between them seems to be wide and increasing; both signs are in favor of an upcoming bullish wave
- The 3 moving averages of William’s alligator are about to align with the red line in the middle, the blue below and the green above both, which would signal a bullish wave.
Accordingly, a bullish wave can be observed during the next 8 hours.
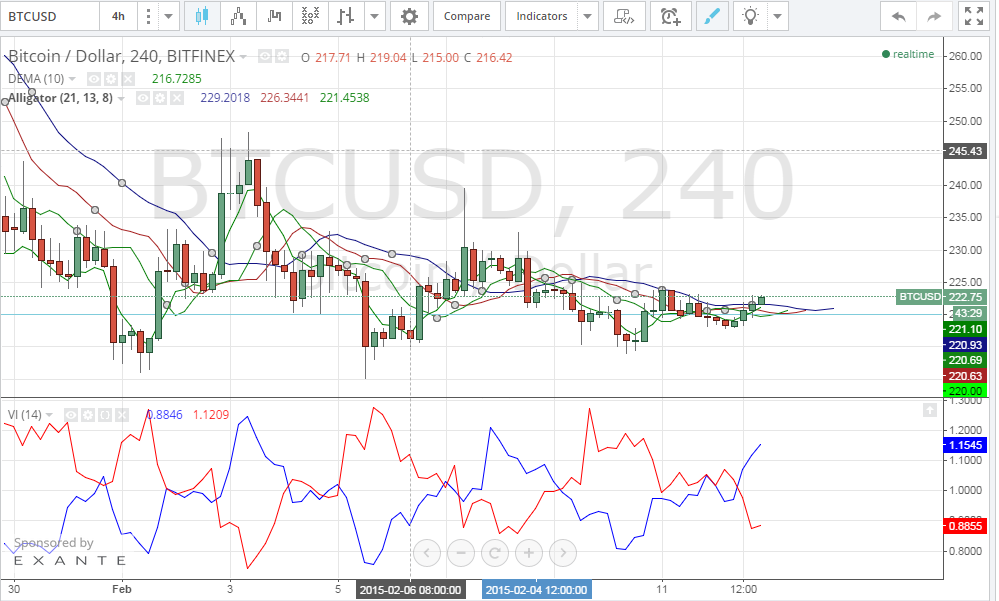
Note: The Vortex Indicator and William’s Alligator indicator are usually used on 1 day Forex charts, but we have been using both of them to analyze 1 hour (BTC/USD) charts to predict short trends. We used a 14 hour period to calculate the value of the Vortex Indicator trends. We used the 13 hour, 8 hour and 5 hour moving averages to plot William’s Alligator “lips,” “teeth” and “jaw” respectively.
Conclusion:
Bitcoin price continues to resist dropping below $220. Analysis points to the high probability of an upcoming bullish wave.
Charts from Bitfinex.


All aboard! (again………….)