Bitcoin Price Key Highlights
- Bitcoin price continues to trend lower and has just dipped below the $13,500 mark.
- Price seems to be drawing some support from this area, though, probably making its way up for a correction.
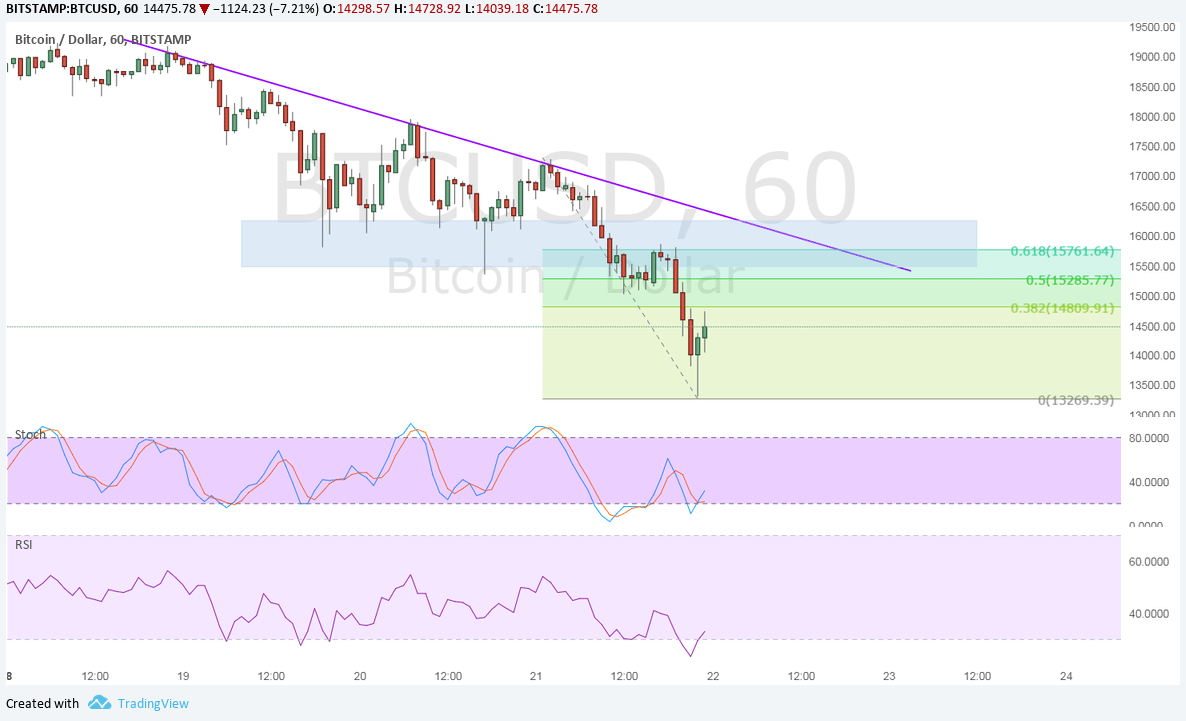
- Applying the Fib retracement tool shows the nearby inflection points that might serve as resistance.
Bitcoin price is trending lower on its 1-hour time frame and might be due for a pullback to the area of interest at $16,000.
Technical Indicators Signals
The 100 SMA is below the longer-term 200 SMA to confirm that the path of least resistance is to the downside. This means that the selloff is more likely to resume than to reverse.
The 61.8% Fib is closest to the falling trend line resistance that’s been holding for the past few days. It also coincides with the broken support at the $16,000 longer-term area of interest.
The 38.2% Fib is near the $15,000 psychological level which might also contain plenty of sell orders. The 50% Fib is located at $15,285.
Stochastic is pulling up from oversold territory to reflect a pickup in buying pressure that could allow the correction to stay in play for a while. RSI is also pulling up so bitcoin price might follow suit.

Market Factors
The persistent slide in bitcoin price has probably been leading traders to liquidate their positions before the year comes to a close. The euphoria over the launch of bitcoin futures has faded after all, and there are no major catalysts that could spring another rally.
Then again, there are a few network upgrades scheduled all the way until March next year and this would still likely leave bitcoin stronger than ever. However, issues pertaining to bitcoin trading manipulation have eroded confidence in the cryptocurrency somewhat.
Meanwhile, the dollar remains strongly supported by tax reform progress as the government is on track towards implementing corporate tax cuts soon. This would be very positive for businesses and consumers, thereby upping the chances of seeing more Fed rate hikes next year.


