Bitcoin Price Key Highlights
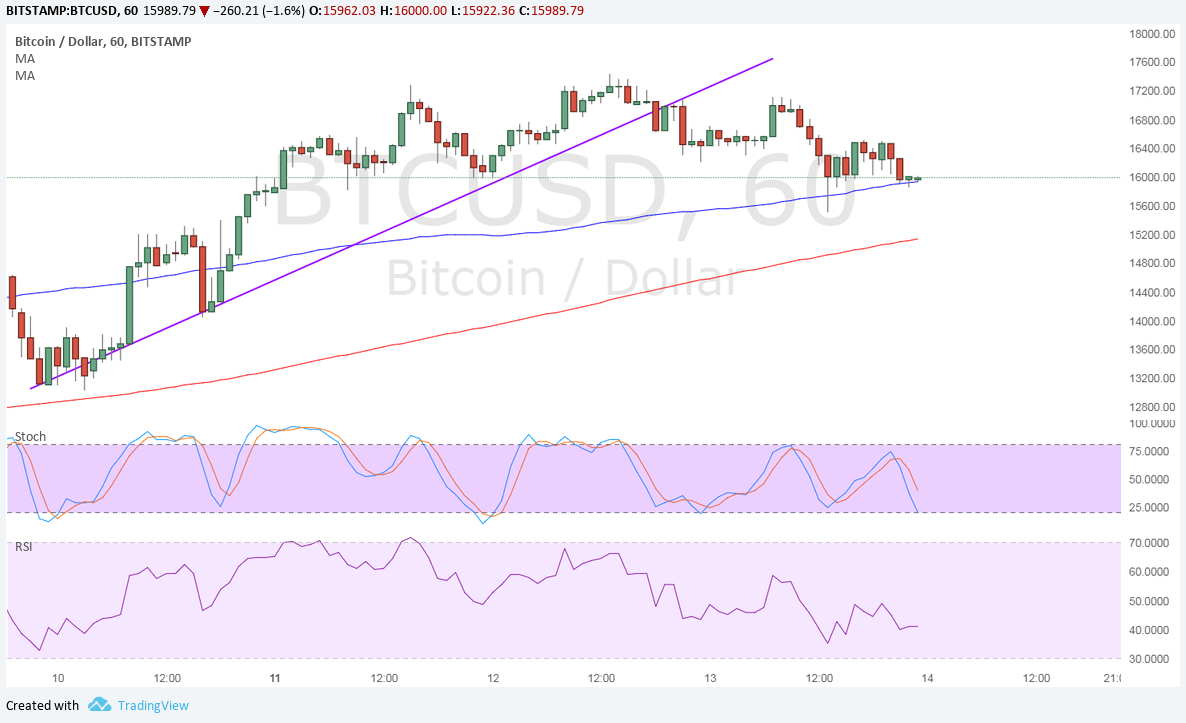
- Bitcoin is in another day of consolidation and may be in for a few more losses as it formed a short-term reversal pattern.
- Price has formed a small head and shoulders on its 1-hour time frame and appears to have broken below the neckline.
- This comes after a move below a short-term ascending trend line.
Bitcoin could be in for a few more losses from here as price made a reversal pattern and broke below a short-term trend line.
Technical Indicators Signals
The 100 SMA is above the longer-term 200 SMA so the path of least resistance is to the upside. This signals that the uptrend is still likely to resume soon. In addition, the 100 SMA is holding as dynamic support.
However, the gap between the moving averages is narrowing to reflect slowing bullish momentum. If a downward crossover materializes, more sellers could join in. The head and shoulders spans $16,500 to $17,500 so bitcoin price could fall by around $1,000.
Stochastic is pointing down to show that sellers are in control while buyers take a break. RSI appears to be treading sideways to indicate further consolidation.

Market Factors
The dollar actually weakened against its fiat counterparts after the FOMC decision but it still managed to hold on to its gains versus bitcoin price. Yellen reiterated her cautious inflation outlook while taking a swipe at bitcoin for being a highly-speculative asset.
Still, the updated economic projections hinted at further tightening in 2018 and it also helped that growth and jobs forecasts were upgraded. In other US news, lawmakers agreed on the tax bill and are set to vote on it next week.
As for bitcoin price itself, the launch of CBOE futures has propped price up but traders appear to be more skeptical as price goes on to reach more record highs. CME and Nasdaq are set to launch their own futures soon, bringing another influx of investor interest, which typically translates to higher volumes and increased trading activity.


