Bitcoin Price Key Highlights
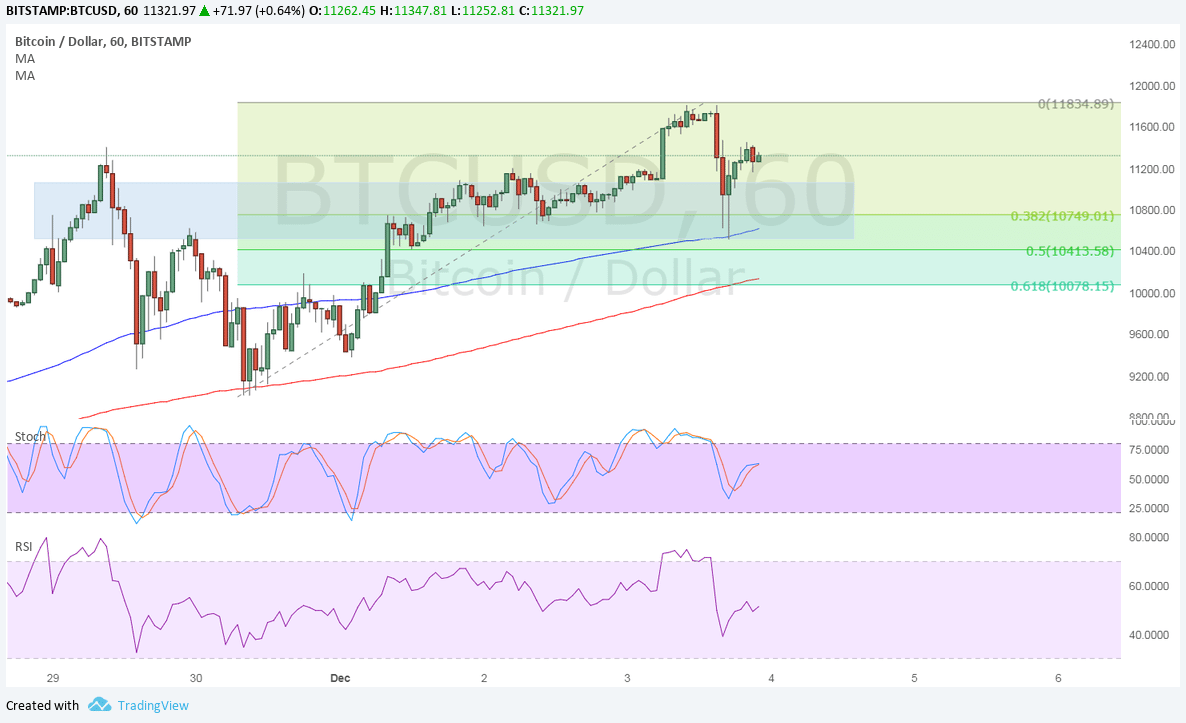
- Bitcoin price zoomed up to one of the Fib extension levels marked in an earlier article before making another correction.
- Applying the Fib retracement tool on this move shows the nearby support levels.
- Price is currently testing an area of interest that might be enough to hold as a floor.
Bitcoin price is pulling back from yet another strong rally to new sets of highs, possibly drawing more buyers in.
Technical Indicators Signals
The 100 SMA is above the longer-term 200 SMA on the 1-hour time frame, so the path of least resistance is to the upside. The short-term moving average appears to be holding as dynamic support as well since it lines up with an area of interest.
At the same time, this former support turned resistance level coincides with the 38.2% Fibonacci retracement level around $10800. The 200 SMA lines up with the 61.8% Fibonacci retracement level near $10000, serving as the line in the sand for the uptrend.
Stochastic appears to be on the move up to show that buying pressure is present. If so, bitcoin price could make it back to the swing high at $11834.89 or higher.
RSI, on the other hand, seems to be heading south so bitcoin price could follow suit and spur a larger correction until the oscillator hits oversold levels and turns back up.

Market Factors
Dollar weakness has contributed to the surge in bitcoin price over the past few days as jitters over potential impeachment on Trump’s dealings with Russia have weighed on the currency.
As for bitcoin price itself, traders are turning their attention to the December 18 launch of three bitcoin derivative products that could allow investors to short the cryptocurrency. This might bring in a fresh wave of volatility that could either undo the strong rallies or lead to more.
Traders are also anticipating the launch of CME bitcoin futures before the end of the year that would make it more accessible to retail investors.


