Bitcoin Price Key Highlights
- Bitcoin price is sliding from its recent highs, indicating that a correction is underway.
- This follows the bearish divergence highlighted in a previous article.
- Traders appear to be booking profits at the moment, but more buyers could join in once the nearby area of interest is tested.
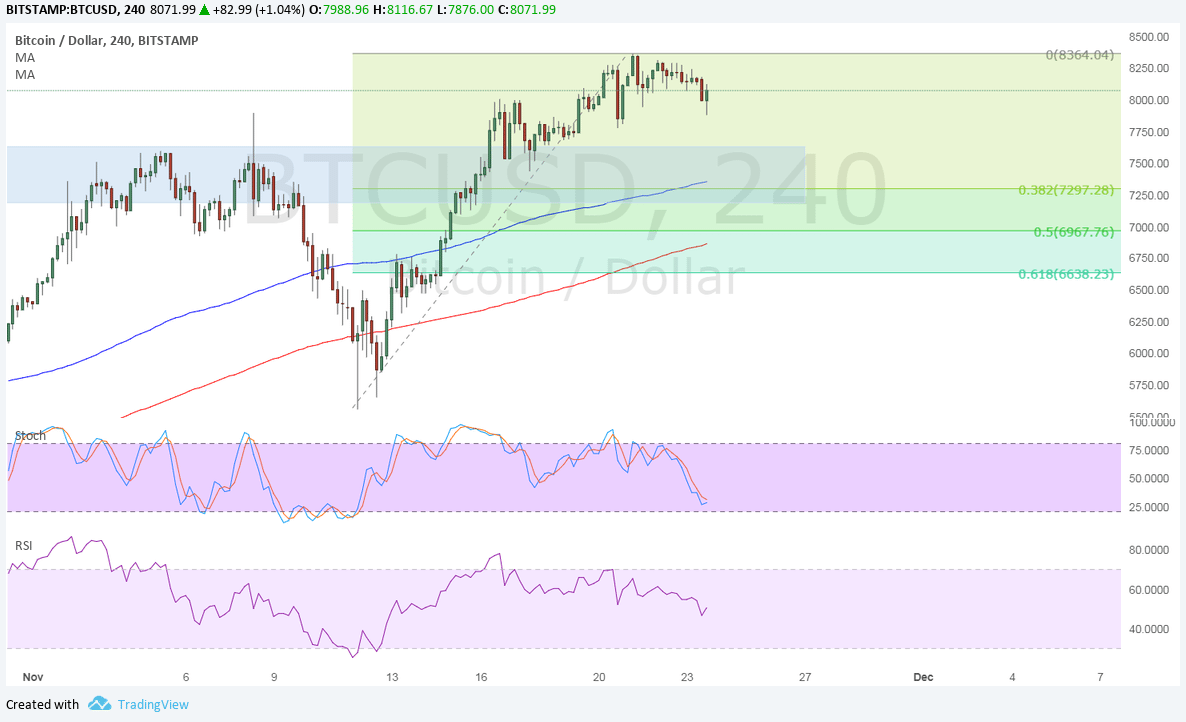
Bitcoin price is pulling back from its strong rally and could be due for a test of the former resistance around $7500.
Technical Indicators Signals
The 100 SMA is above the longer-term 200 SMA on this time frame so the path of least resistance is to the upside. This means that the uptrend is more likely to resume than to reverse.
Applying the Fibonacci retracement tools on the latest rally shows that the 38.2% level lines up with the 100 SMA dynamic support. The 200 SMA is closer to the 50% Fib, adding to its strength as a potential floor as well. The line in the sand for a correction might be the 61.8% Fib at $6600.
Stochastic is on the move down to confirm that selling pressure is in play. RSI is also heading south, so the correction could go on for a while. However, both oscillators are also nearing oversold levels to reflect exhaustion among bears and a likely return in bullish pressure.

Market Factors
Traders continue to lighten up on their bitcoin holdings over the Thanksgiving holidays for fear of a news update triggering a larger than usual reaction on lower market liquidity.
However, the dollar remains on weak footing, thereby limiting bitcoin price losses. Trader are adjusting positions to reflect the more cautious Fed outlook on inflation, with policymakers worrying that it would take longer to hit the 2% target than initially anticipated.
As for bitcoin price itself, any announcement on CME bitcoin futures could be bullish, especially if the group confirms its launch date for the year. For now, it is still pending regulation and any major roadblocks could lead to larger dips.


