Bitcoin Price Key Highlights
- Bitcoin price hasn’t bounced back from its rally correction, indicating that bearish pressure is taking hold.
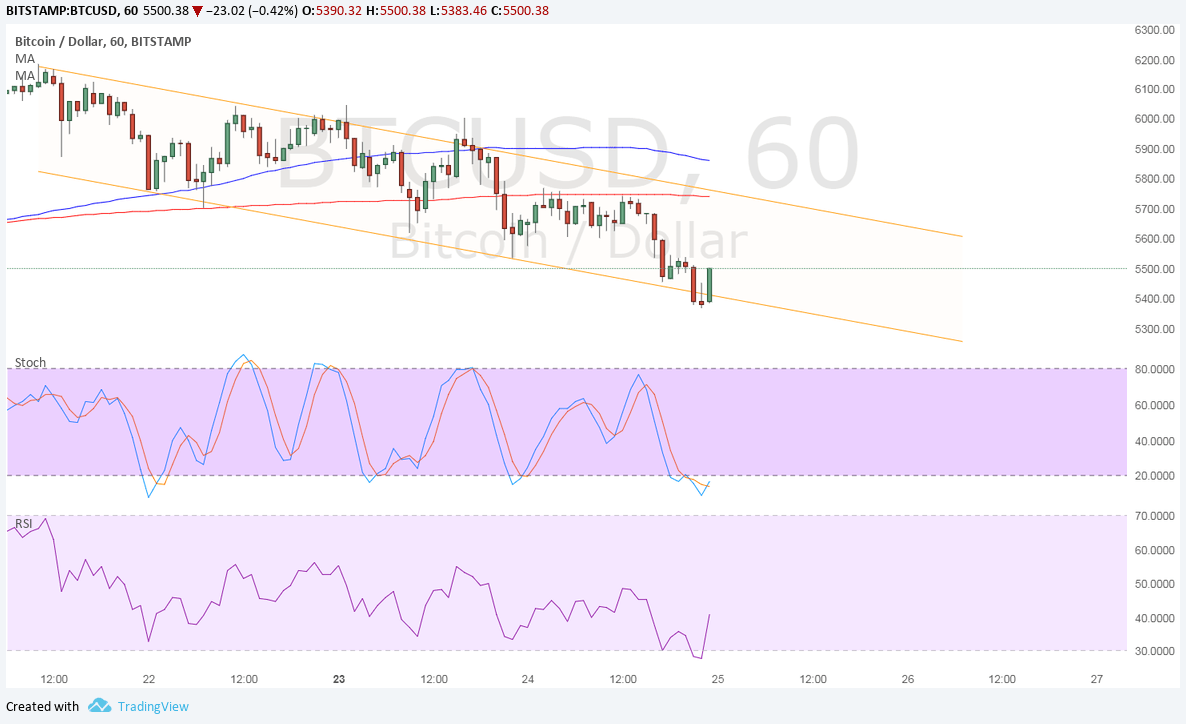
- Price is trading inside a descending channel on its 1-hour time frame and is currently testing support.
- A bounce off this area could lead to a test of the channel resistance and a continuation of the selloff.
Bitcoin price is trading lower inside a descending channel on its short-term time frame and might be due for a test of resistance.
Technical Indicators Signals
The 100 SMA is above the longer-term 200 SMA so the path of least resistance is to the upside. This means that there’s a chance the channel top could be broken and the longer-term climb could resume.
However, the 200 SMA is close to the channel resistance, adding to its strength as a ceiling. The gap between the moving averages is also narrowing to signal a potential downward crossover and pickup in selling momentum.
Stochastic is already indicating oversold conditions and might be ready to pull up. RSI is starting to head higher so bitcoin price might follow suit. There is an area of interest or former support around the channel resistance at $5600.

Market Factors
Dollar demand has kicked higher on reports that Trump might pick John Taylor as the next Fed Chairperson. He is seen to be a more hawkish pick compared to other candidates and the fact that GOP Senators expressed support for him could up his odds.
The White House has said that an announcement will be made in the coming days so dollar traders are on edge. Trump has also hinted that current head Yellen is still an option.
Meanwhile, bitcoin price has been on the decline as rival version bitcoin gold is going live. This could mean more complications in the hard fork as the network upgrade looms, but if the previous hard fork is any indication, the core version could still smoke out the competition and emerge even stronger.


