Bitcoin Price Key Highlights
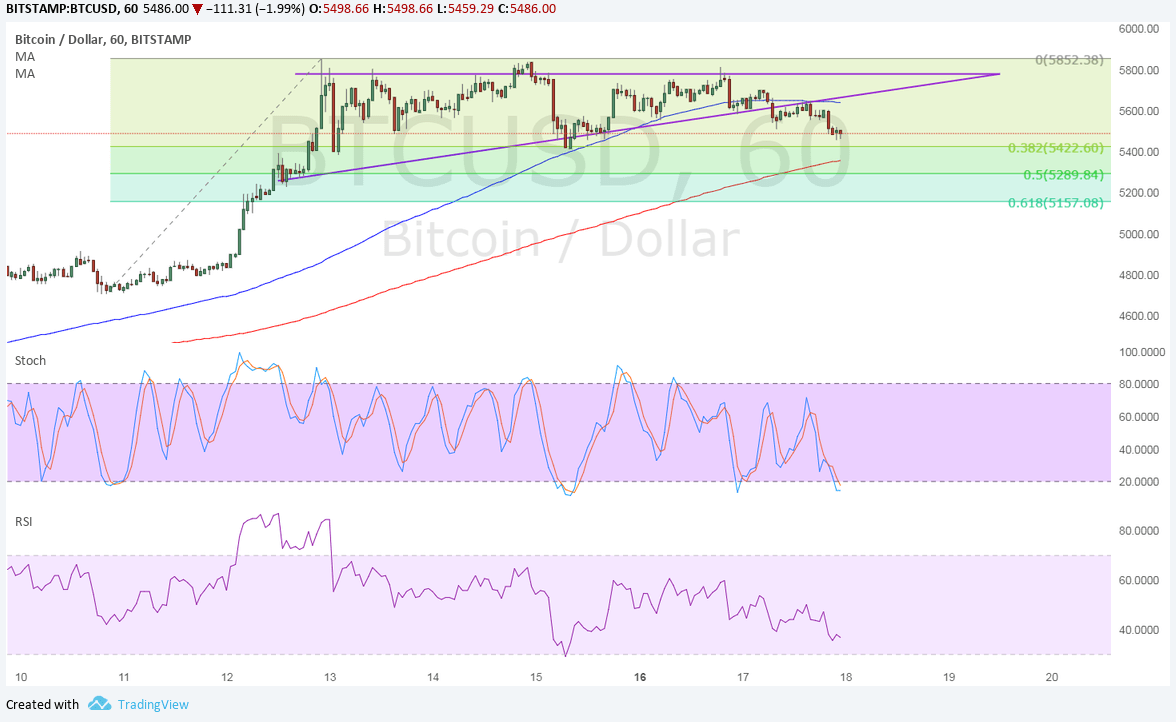
- Bitcoin price recently broke below the support of an ascending triangle highlighted in a previous article.
- This could be indicative of a short-term selloff that’s roughly the same height as the chart formation.
- A double top pattern can also be seen and bitcoin price is moving closer to testing the neckline around $5400.
Bitcoin price is showing a handful of potential selloff signals while bulls book profits off their recent positions.
Technical Indicators Signals
The 100 SMA is above the longer-term 200 SMA to show that the path of least resistance is to the upside or that the rally is more likely to resume than to reverse. However, the gap between the moving averages is narrowing to signal a potential downward crossover that would draw sellers in.
Price has also dropped below the 100 SMA as an early signal of a pickup in bearish pressure. Bitcoin price could still find support at the 200 SMA dynamic inflection point, which is near the 50% Fibonacci retracement level.
Stochastic is on the move down but is already indicating oversold conditions, which means that sellers are tired and willing to let buyers take over. RSI is still heading lower so bitcoin price might follow suit until the nearby Fib levels.

Market Factors
Dollar demand has picked up on hawkish Fed rhetoric and the possibility of seeing a more hawkish future Fed head than previously anticipated. Medium-tier reports have also been either better than expected or in line with consensus, which continues to support the idea of a December hike.
Meanwhile, geopolitical risk appears to be fading on all fronts, including North Korea and in Spain. There are other sources of conflict, though, particularly in Iran and in other parts of Europe.
Traders might also be lightening up on their long bitcoin positions ahead of the network upgrade next month, although many are still hopeful that it would yield the same kind of price action as in the August upgrade.


