Bitcoin Price Key Highlights
- Bitcoin price recently surged to new record highs, indicating that bullish momentum is strongly in play once more.
- Price appears to be stalling from its rally so a pullback opportunity might present itself.
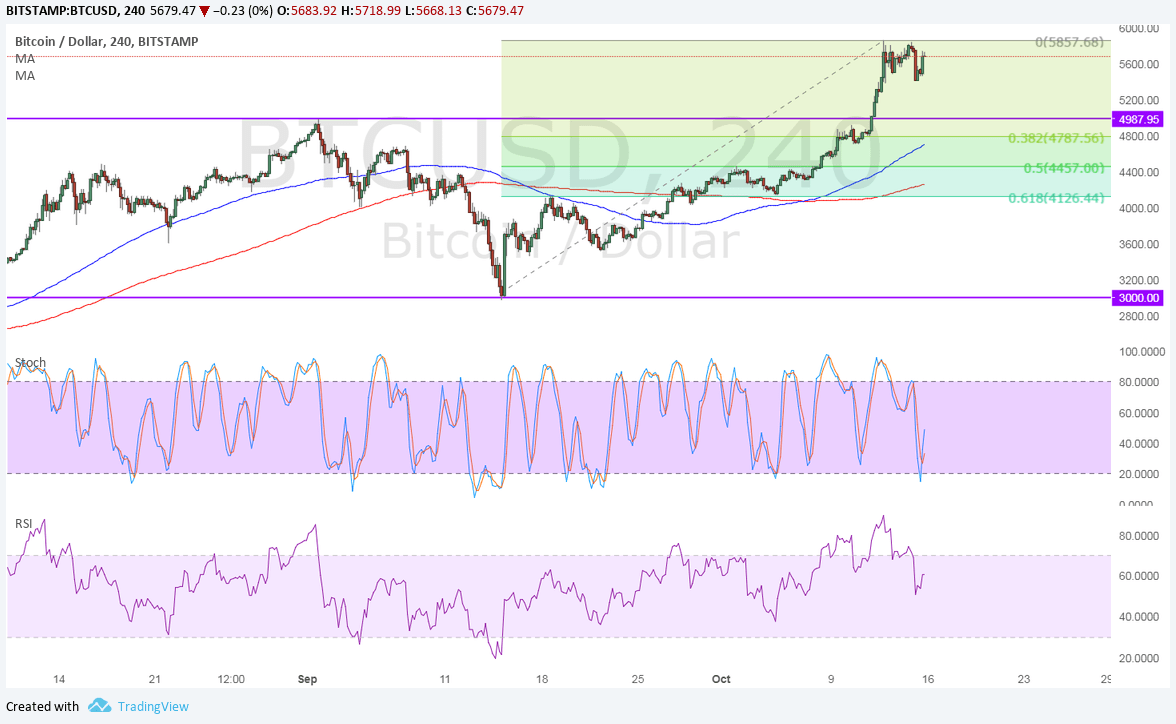
- Technical indicators are mostly signaling that the uptrend could resume, and the Fib tool shows the potential correction levels.
Bitcoin price could be due for a pullback after its strong breakout move, with tech indicators confirming that the rally could resume.
Technical Indicators Signals
The 100 SMA is above the longer-term 200 SMA so the path of least resistance is to the upside. In other words, the rally is more likely to resume than to reverse. The short-term moving average lines up with the broken resistance area at $4800-5000 while the 200 SMA is slightly above the 61.8% Fib at $4126.44.
Stochastic seems to be pulling up from the oversold area to indicate a return in bullish momentum. This could also mean that buyers are eager to hop back in and push for new highs with a very shallow pullback.
However, RSI is still on the move down to show that bearish pressure is kicking in. In that case, a deeper pullback to the lower Fibs could be in the cards, and a breakdown could even spur a test of the range support at $3000.

Market Factors
The odds are looking against the dollar these days, especially since CPI readings came in below expectations for September. However, Yellen sounded hawkish in her testimony over the weekend so December hike expectations could stay supported while 2018 tightening forecasts appear to have been dampened.
As for bitcoin price, the attention is mostly on the next network upgrade in November and investors are hoping to see a similar reaction to the August upgrade that pushed the cryptocurrency to record highs.
A rival version called bitcoin gold has emerged but it could suffer the same fate as bitcoin cash and render the original version stronger instead of splitting into separate cryptocurrencies.


