Bitcoin Price Key Highlights
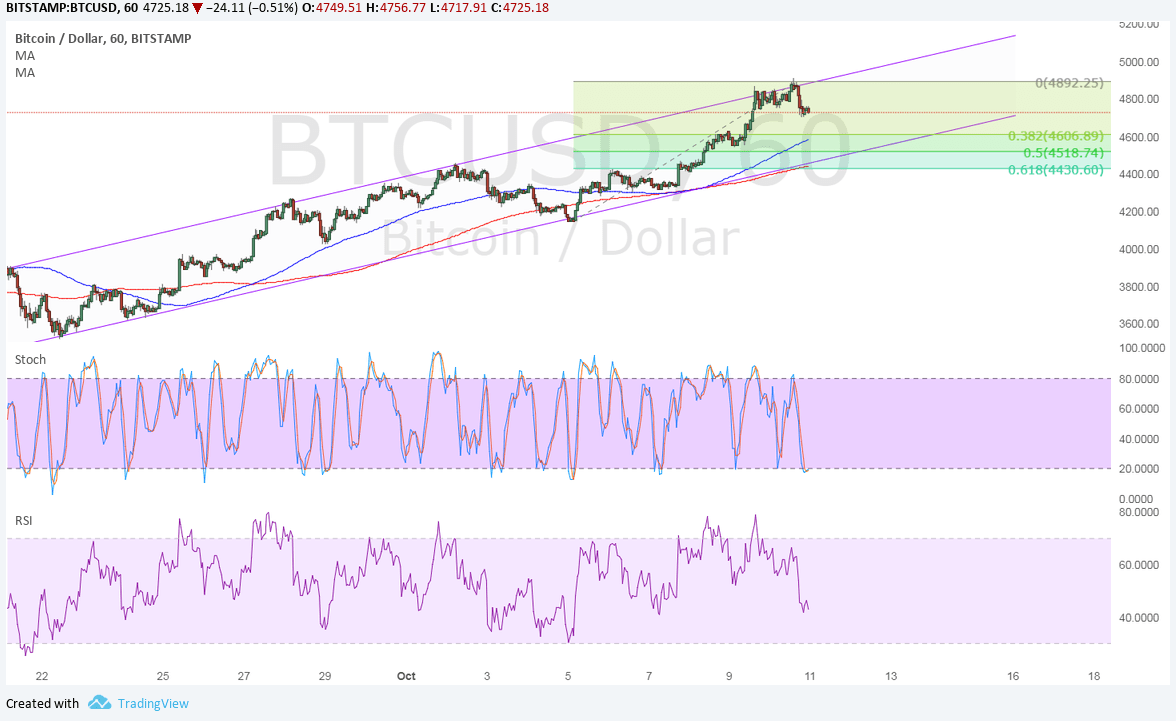
- Bitcoin price is gaining traction on its climb, moving inside an ascending channel formation on its 1-hour time frame.
- Price is currently testing the resistance close to the record highs and might be due for a quick pullback to support.
- Applying the Fib tool on the latest swing low and high shows the near-term support zones.
Bitcoin price is in for a correction to the ascending channel support while it gears up for an attempt to break past the all-time highs.
Technical Indicators Signals
The 100 SMA is above the longer-term 200 SMA so the path of least resistance is to the upside, which means that the rally is more likely to continue than to reverse. The gap between the moving averages is widening to reflect strengthening bullish momentum as well.
The 100 SMA is close to the 38.2% Fibonacci retracement level around $4600 while the 200 SMA coincides with the channel support and 61.8% Fib at $4400. If any of the retracement levels keep losses in check, bitcoin price could move back to the swing high around $4900 or higher.
Stochastic is heading lower but is already dipping into oversold territory, which suggests that bears could take a break soon. RSI has a bit more room to drop so bearish pressure could stay in play for a bit longer until the oscillator turns up from the oversold region. A break below the 200 SMA, however, could be an early signal of a reversal.

Market Factors
Bitcoin price could stay supported as geopolitical risks linger, especially since North Korea appears to be returning to the spotlight once more. South Korea reportedly flew plans over the peninsula as a show of force, possibly eliciting another hostile reaction from Pyongyang at some point.
Meanwhile, the dollar is under a bit of pressure since the Trump administration is encountering some headwinds in tax reform. The FOMC minutes are also up for release and it might not be as hawkish as the actual statement turned out, given how a number of policymakers have expressed cautious views on inflation recently.


