Reason to trust

How Our News is Made
Strict editorial policy that focuses on accuracy, relevance, and impartiality
Ad discliamer
Morbi pretium leo et nisl aliquam mollis. Quisque arcu lorem, ultricies quis pellentesque nec, ullamcorper eu odio.
Bitcoin Price Key Highlights
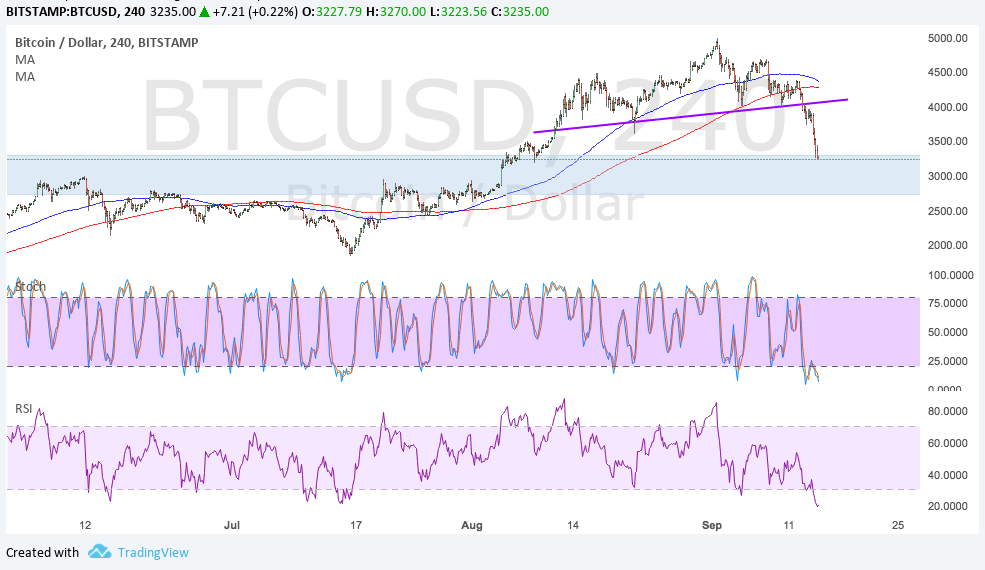
- Bitcoin price recently broke below the neckline of the head and shoulders pattern highlighted in a previous article.
- Price broke to the downside as bearish factors lined up and risk sentiment also flipped.
- Bitcoin is has been on a steep drop but is on its way to testing an area of interest that could draw some buyers in.
Bitcoin price confirmed the reversal signal shown by the head and shoulders formation and is on its way to testing $3000.
Technical Indicators Signals
The 100 SMA is still above the longer-term 200 SMA on the 4-hour time frame, so the path of least resistance could be to the upside. However, the gap between the two has significantly narrowed to signal that a downward crossover is imminent, drawing more sellers to the mix.
Stochastic is heading south to indicate that bitcoin price is being driven by sellers at the moment. RSI is also moving lower so bitcoin could follow suit, but the oscillator is also dipping into oversold levels to indicate selloff exhaustion.
If the area of interest around $2500 to $3000 holds as support, price could still pull back to the broken neckline support near the moving averages before resuming its drop. The reversal formation is approximately $1000 tall so the selloff is likely to last until $3000.

Market Factors
There have already been a few factors keeping a lid on bitcoin price gains for the past few days but the floodgates opened when BTCChina confirmed that they would be halting trading on September 30 in compliance with government regulation. This led to a flurry of liquidation as Chinese investors rushed to recover their funds before other exchanges shut down.
Apart from that, the dollar is enjoying strong upside momentum on tax reform talks and renewed Fed rate hike expectations. Headline CPI came in stronger than expected, upping December tightening odds to nearly 50/50. A risk factor to this down move, however, is the threat that North Korea will attack Japan or the US in response to the latest set of sanctions from the UN.


