Bitcoin Price Key Highlights
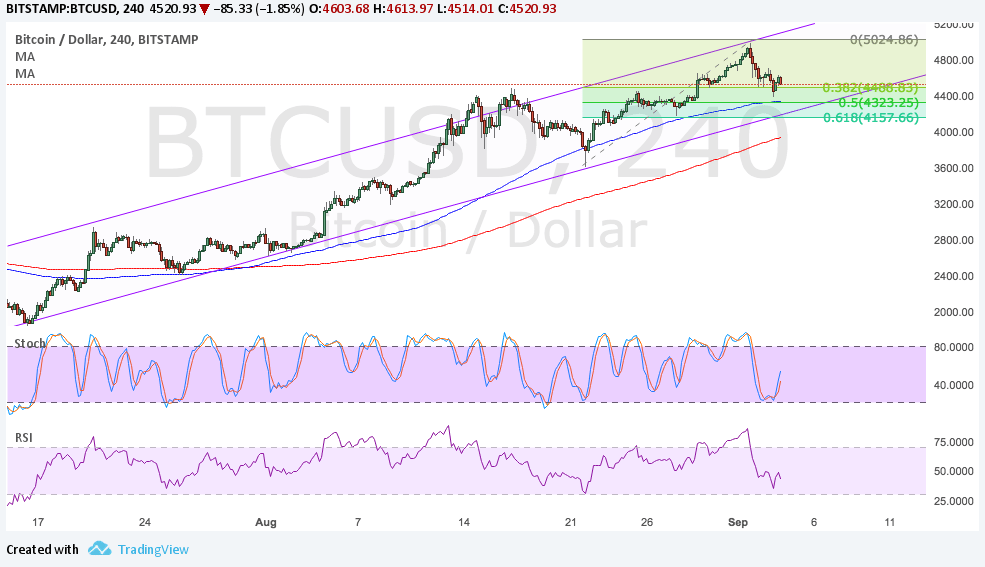
- Bitcoin price found resistance at the top of its ascending channel at $5000 as expected.
- Price is now pulling back towards support to gather more bullish energy to sustain the climb.
- Applying the Fib tool on the latest swing low and high on the 4-hour chart shows that potential pullback levels.
Bitcoin price is in correction mode after hitting new highs at the channel resistance and $5000 area.
Technical Indicators Signals
The 100 SMA is above the longer-term 200 SMA so the path of least resistance is to the upside. The short-term moving average lines up with the 50% Fibonacci retracement level, which appears to be holding as support already.
A larger correction could last until the 61.8% Fib at $4157 or until the 200 SMA dynamic inflection point close to $4000. A break below this area, on the other hand, could signal that bears are regaining control of bitcoin price action.
Stochastic is pulling up from the overbought zone to show a return in bullish momentum. RSI seems to have room to head further south so bitcoin price might stay in correction mode for a bit longer. If any of the Fib levels hold as support, price could hit the swing high or the channel resistance at $5200 next.

Market Factors
Geopolitical risk is picking up once more as North Korea launched a larger missile test, reviving fears of an actual strike sooner or later. South Korea also conducted its own missile test so there are speculations that a full-blown war could follow.
Meanwhile, US officials have previously noted that any threat to its allies could be met with massive military response and that they have plenty of options on the table. Data from the US economy turned out weaker than expected on Friday, dampening hopes of a Fed rate hike this month but still keeping December tightening expectations in play.
Looking ahead, worsening tensions between the Koreas and with the US could keep global stocks in selloff mode and force investors to move funds to alternative assets like bitcoin.


