Bitcoin Price Key Highlights
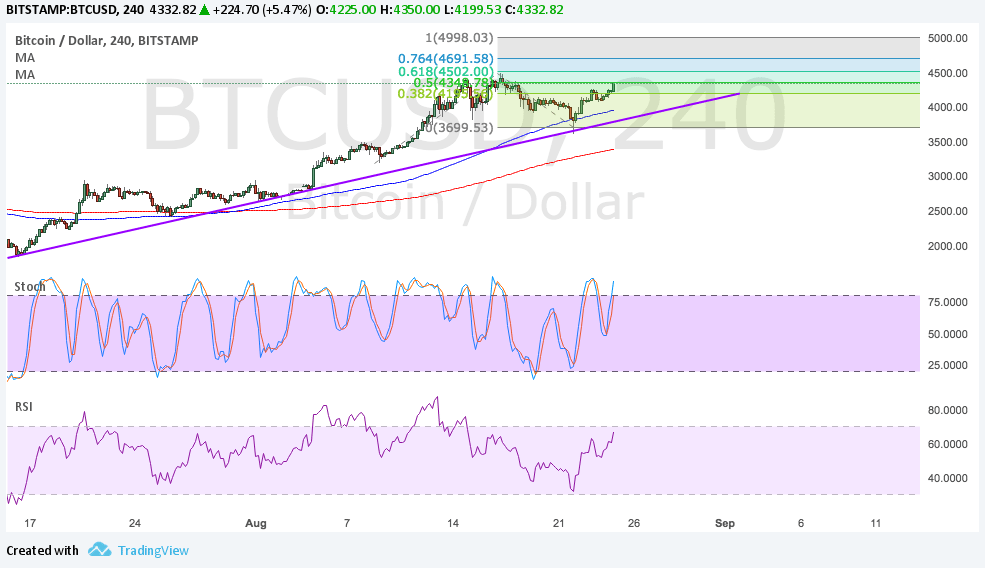
- Bitcoin price is regaining bullish momentum after bouncing off the rising trend line visible on its 4-hour chart.
- Applying the Fib extension tool shows how high bitcoin price could go from here.
- Technical indicators are showing that the rally is more likely to persist rather than reverse.
Bitcoin price is resuming its climb and might be on its way to create new all-time highs again.
Technical Indicators Signals
The 100 SMA is above the longer-term 200 SMA so the path of least resistance is to the upside. Also, the gap between the moving averages is getting wider to reflect stronger bullish momentum. The 100 SMA is still close to the rising trend line, adding to its strength as a floor in the event of another pullback.
Bitcoin price is currently stalling at the 50% extension level which is close to the previous highs. A break past this level could take it up to the next extension level around $4500. From here, a continuation could take it up to the 76.4% extension near $4700. The full extension is located at the $5000 mark.
Stochastic is pointing back up to indicate a return in buying pressure even without hitting oversold levels. RSI is also pointing up to indicate that buyers have enough energy to push bitcoin price higher.

Market Factors
Bitcoin price is stabilizing once more following the upgrade to SegWit, even after encountering a few roadblocks in the past few days. The SegWit soft fork activated and initiated changes to the bitcoin protocol that could enable it to handle more transactions than usual.
Meanwhile, the dollar is under some pressure due to growing rifts within the Trump administration that could limit the government’s ability to push its fiscal reform agenda forward. Also, the dollar could be sensitive to remarks from Fed head Yellen during the Jackson Hole Symposium, with many expecting her to downplay the odds of another interest rate hike in September. The lack of details on the balance sheet runoff could also be dollar bearish as well.


