Bitcoin Price Key Highlights
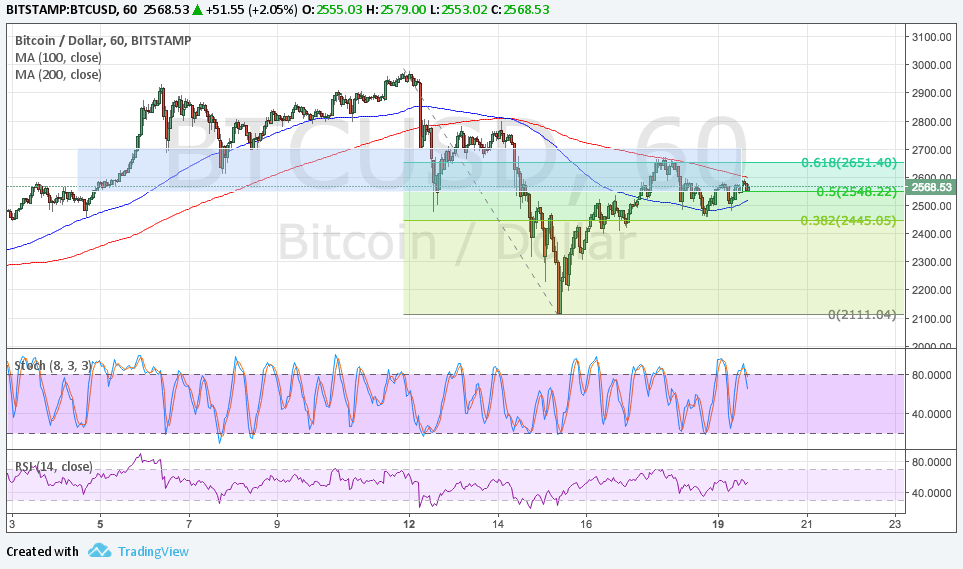
- Bitcoin price recently broke below support around $2500 and dipped to the $2100 area.
- Price has since rallied and tested the broken support, which lined up with the 61.8% Fibonacci retracement level.
- This area is holding as resistance so bitcoin price could fall back to the swing low.
Bitcoin price is completing a correction on its 1-hour time frame as the area of interest is holding as a ceiling.
Technical Indicators Signals
The 100 SMA is below the longer-term 200 SMA on the 1-hour chart so the path of least resistance is to the downside. However, the gap between the moving averages is narrowing to suggest a potential upside crossover and a return in buying pressure.
If so, bitcoin price could make another attempt to bust past the resistance and move back to the all-time highs near $3000. The 200 SMS is holding as dynamic resistance for the time being, though.
Also, stochastic is pointing down from the overbought zone to indicate a pickup in bearish pressure. RSI is trading sideways but seems to be crawling higher to indicate that there’s some bullish momentum in play.
Stronger selling pressure could even take bitcoin price below the swing low to breach the neckline of its head and shoulders pattern visible on longer-term time frames. In that case, a longer-term downtrend could be in the cards.

Market Factors
Dollar demand has picked up at the start of the week thanks to upbeat remarks from FOMC policymaker Dudley. He noted that growth has been well-distributed and that the Fed should carry on with its tightening timeline. He also expressed confidence that wage growth will pick up as soon as productivity does, which would be positive for overall inflation.
Meanwhile, risks associated to Brexit could keep market uncertainty in play, which is usually positive for bitcoin price. European traders could unwind their long euro and pound positions and transfer funds to bitcoin instead, provided that there are no negative updates from the industry moving forward.


