Bitcoin Price Key Highlights
- Bitcoin price is still in an uptrend and attempting to break past the $9000 barrier.
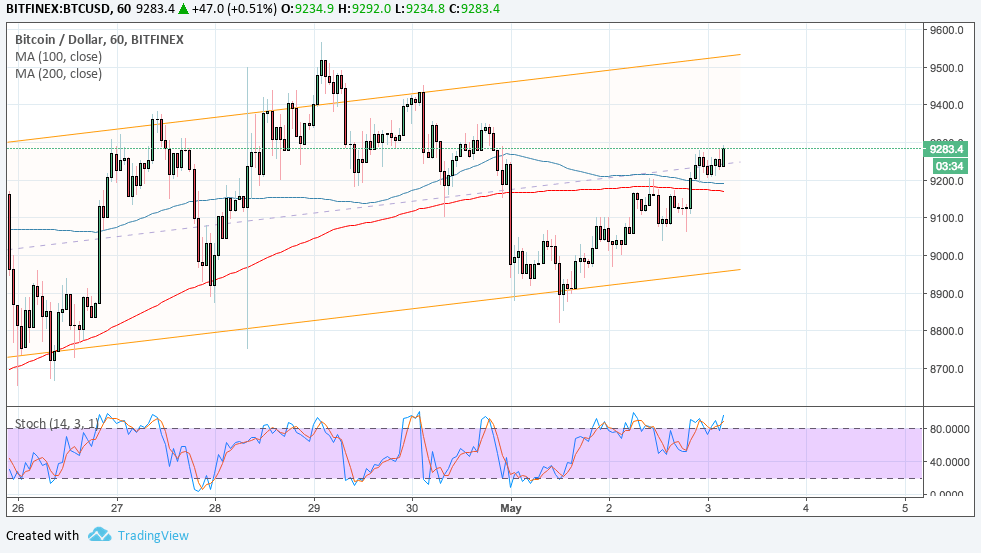
- Price is also inside an ascending channel on its 1-hour chart and appears to be setting its sights on the top.
- A continuation of the rally could take bitcoin price up to the $9500 level.
Bitcoin price bounced off the bottom of its ascending channel pattern on the 1-hour chart to show that bulls are still in the game.
Technical Indicators Signals
The 100 SMA is above the longer-term 200 SMA to indicate that the path of least resistance is to the upside. In other words, the rally is more likely to continue than to reverse. However, the gap between the moving averages has narrowed to signal weaker bullish momentum.
If a downward crossover materializes, bitcoin price could fall back to the channel support at $9000 for another test. Stochastic is already dipping into overbought territory to reflect exhaustion among buyers, which suggests that sellers have a chance at taking over.

Market Factors
The dollar got a boost even after a brief selloff during the FOMC statement. Policymakers made some notable changes in their actual statement, leading some to have doubts about the pace of tightening in the months ahead.
Bitcoin price has managed to stay resilient, though, as Goldman Sachs reportedly has plans to have bitcoin trading operations. This way, it can allow its clients to invest some of their funds in the industry, which would be supportive of liquidity and volumes.
As it is, bitcoin is already gaining adoption as a store of value and medium of exchange, which could continue to keep prices supported. Apart from that, many expect more exchanges to go live or tap into more markets, also supporting trade activity.
Lastly, the emergence of ETFs based on bitcoin could create simpler ways for the investing public to enter the space.


