Bitcoin Price Key Highlights
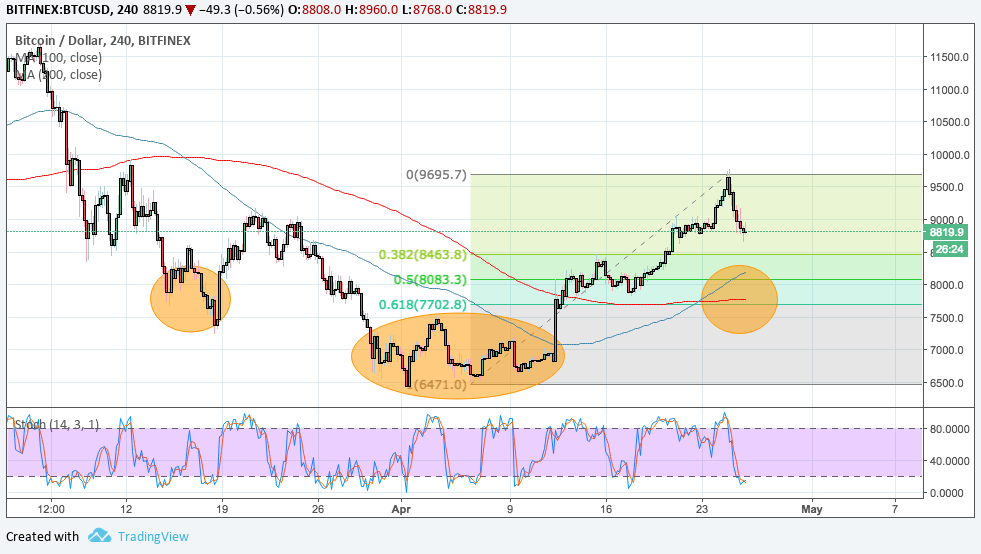
- Bitcoin price is correcting from its recent climb but might be on track to form a larger reversal pattern.
- A bounce off the area of interest could lead to the formation of an inverse head and shoulders.
- Technical indicators are reflecting the presence of bullish pressure.
Bitcoin price looks ready to form an inverse head and shoulders pattern if it completes this correction.
Technical Indicators Signals
The 100 SMA has crossed above the longer-term 200 SMA to indicate that the path of least resistance is to the upside. This means that the uptrend is more likely to resume than to reverse.
These moving averages could also serve as dynamic inflection points near the Fib levels. In particular, the 100 SMA is near the 50% Fib at $8083.3 while the 200 SMA coincides with the 61.8% Fib at $7702.8. If this holds as support, bitcoin price could bounce up to the swing high at $9695.7 which might be the neckline of the reversal formation.
Stochastic is also indicating oversold conditions to show that selling pressure is exhausted and that buyers could return soon. A shallow pullback could last until the 38.2% Fib at $8463.8.
The chart pattern spans $6000 to $9700 so the resulting rally could be of the same height. A break below the Fibs, however, could indicate that longer-term selling pressure is still present.

Market Factors
The US dollar extended its gains across the board as US bond yields continued to rise. Next week’s FOMC decision and NFP report, particularly expectations for these top-tier events, could drive dollar movements for the next few days.
Meanwhile, sentiment in the cryptocurrency remains positive but it’s also understandable that investors are being cautious. Price is testing key areas of interest that could serve as take-profit points, spurring a much-needed pullback from the latest rally.
Keep in mind that the 17 millionth bitcoin is about to be mined, which marks another milestone for the cryptocurrency as only 21 million bitcoins can ever be created.


