Bitcoin Price Key Highlights
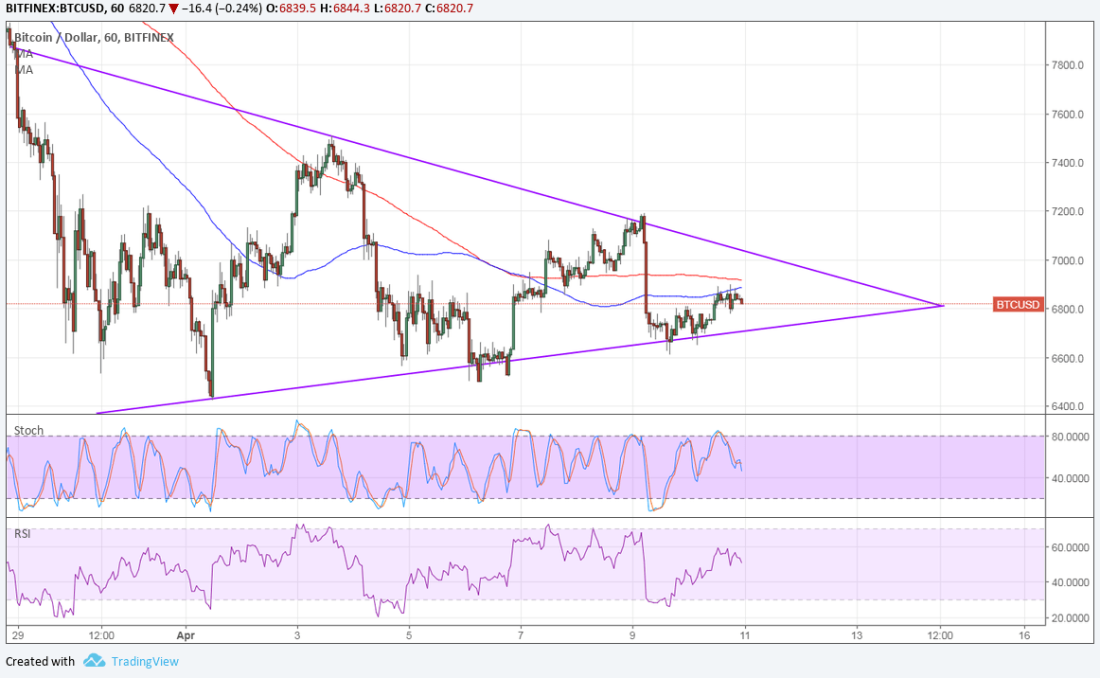
- Bitcoin price has formed lower highs and higher lows to consolidate inside a triangle on its 1-hour chart.
- Price found support at the bottom of its symmetrical triangle once more and looks ready for a test of the top.
- Technical indicators mostly seem to be hinting at more gains ahead.
Bitcoin price bounced off the triangle bottom and could be gearing up for a test or break of the resistance.
Technical Indicators Signals
The 100 SMA is below the longer-term 200 SMA to signal that the path of least resistance is to the downside. However, the gap between the moving averages is narrowing to signal weakening bearish pressure and a potential return in buying momentum.
Stochastic is already on its way down to signal that bears are regaining control. In that case, another test of support could be due, especially since the 100 SMA is holding as dynamic resistance so far.
RSI, on the other hand, is moving higher to reflect the presence of bullish pressure. This could be enough to lead to a test of resistance near $7000 or perhaps even a break higher. Note that the triangle spans $6300 to $7800 so the resulting rally could be of the same height. Similarly, a break lower could lead to a drop of the same height.

Market Factors
The recent drop in bitcoin price is being pinned on the looming tax deadline, as the rush to close out positions led to a flurry of profit-taking. However, the sentiment in the industry remains mostly positive as the ban in India and Pakistan has been overshadowed by headlines of big hedge funds investing in the space.
Looking ahead, dollar demand could still play a role in bitcoin price direction as easing trade tensions between the US and China are starting to spur demand for riskier assets like cryptocurrencies. However, strong PPI has renewed focus on fundamentals leading up to the release of CPI and FOMC minutes later today.


