Bitcoin Price Key Highlights
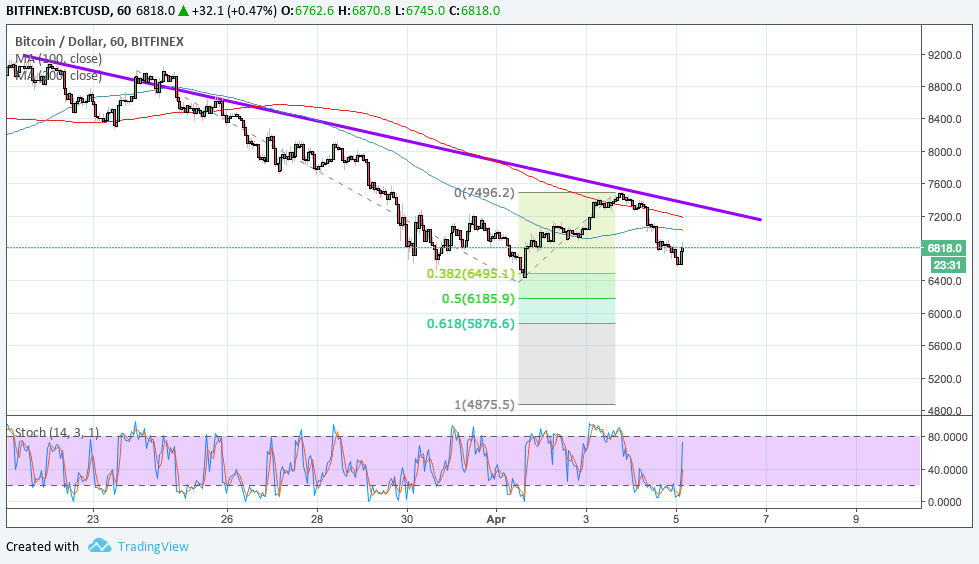
- Bitcoin price is trending lower still after recently pulling back to a descending trend line on its 1-hour time frame.
- Price is eyeing the next downside targets marked by the Fibonacci extension tool.
- Technical indicators are giving mixed signals, but it looks like bears could still win out.
Bitcoin price has resumed its slide after a quick pullback, possibly attempting to make new lows from here.
Technical Indicators Signals
The 100 SMA is below the longer-term 200 SMA to confirm that the path of least resistance is to the downside. In other words, the selloff is more likely to resume than to reverse. The moving averages are also near the descending trend line, adding extra layers of resistance in the event of another pullback.
Stochastic is pointing up to indicate the presence of bullish pressure, though, so bitcoin price might still be able to bounce from here. Upon reaching overbought levels, the oscillator could turn back south to draw sellers back in.
The next potential support is at the 38.2% extension of $6495 near the swing low. The 50% extension is at $6185.90 and the 61.8% extension is at $5876.60. The full extension is located at $4875.50.

If bitcoin price is able to sustain its bounce at current levels, a double bottom pattern could form and this is often considered a classic reversal signal. That way, the neckline would be at $7500 and an upside break could lead to a rally of the same height as the formation.
Market Factors
Analysts point to the global uncertainty spurred by the trade tensions between China and the U.S. as one of the major culprits dragging bitcoin price lower. After all, traders are feeling less hungry for risk, putting their funds in safe-haven assets like the dollar and bonds instead.
Besides, traders might have also taken the recent pullback as an opportunity to liquidate their positions at better prices, fearing that rallies might not last very long in this market environment.


