Bitcoin Price Key Highlights
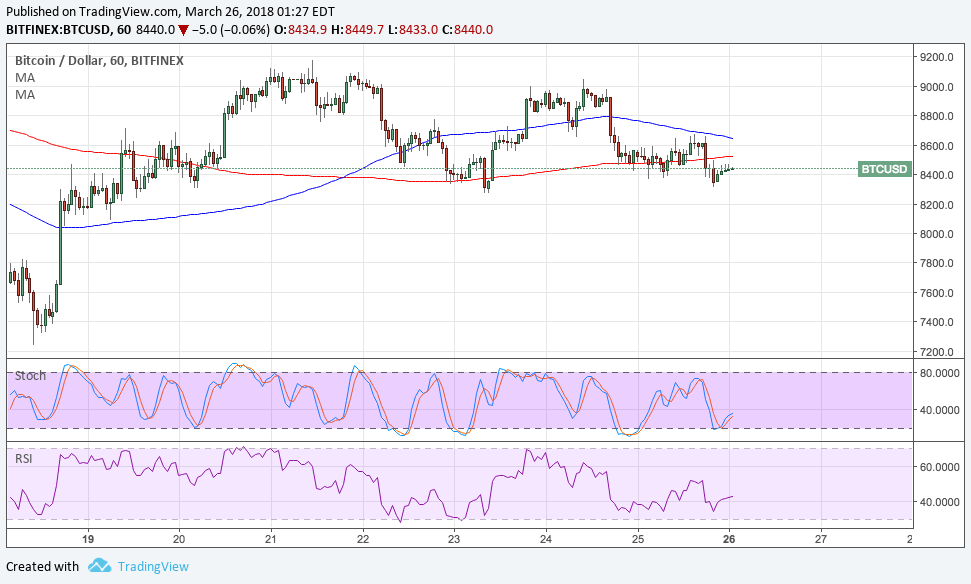
- Bitcoin price could be due for a short-term drop as price formed a double top on the 1-hour time frame.
- Price has also formed lower highs, which also indicates that sellers are pushing harder.
- Technical indicators, however, are still showing some signs that buyers could return.
Bitcoin price has formed a small double top to signal that another wave lower could take place.
Technical Indicators Signals
The 100 SMA is above the longer-term 200 SMA to signal that the path of least resistance is to the upside. This indicates that the rally is more likely to resume than reverse.
However, the gap between the moving averages is narrowing to reflect weakening bullish momentum. If a downward crossover materializes, selling pressure could pick up.
In that case, bitcoin price might break below the neckline at $8,400 and drop by $600 or the same height as the chart pattern. If it holds as support, price could make another top.
Stochastic is pulling up from overbought levels to show that buying pressure is returning. A bit of bullish divergence can be seen as bitcoin price made lower lows while the oscillator had higher lows. RSI is also heading up from the oversold area so price could follow suit.

Market Factors
Trade war jitters are still present in the global markets, leading to risk-off flows which have been more beneficial for the dollar rather than bitcoin price. At the same time, regulatory efforts in Japan are keeping investors on edge.
The country’s FSA has mentioned that it could shut down Binance in the country for failing to secure the necessary licenses to operate. South Korea has shared the same sentiment, and if both countries push through, it could severely dent volumes and activity.
Persistent trade war fears and geopolitical risks could keep the dollar supported in the next few days thanks to its safe-haven appeal and the Fed’s latest interest rate hike.


