Bitcoin Price Key Highlights
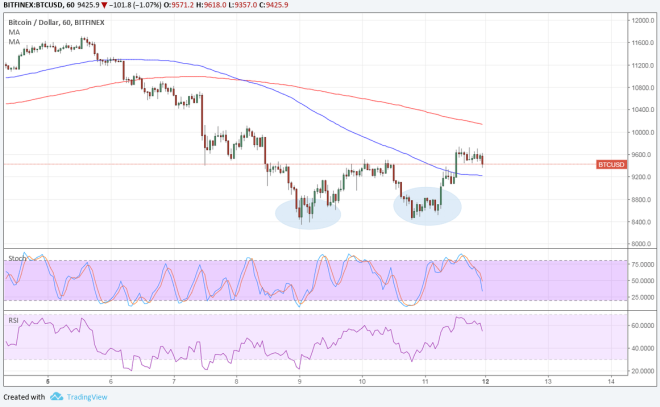
- Bitcoin price looks ready to resume its climb as a double bottom pattern formed on its 1-hour time frame.
- Price has broken past the pattern’s neckline to signal a pickup in buying pressure.
- However, technical indicators are suggesting that the selloff could still resume.
Bitcoin price formed a short-term double bottom pattern and broke past the neckline to reflect a pickup in bullish pressure.
Technical Indicators Signals
The 100 SMA is below the longer-term 200 SMA on this time frame to signal that the path of least resistance is to the downside. In other words, the selloff is still more likely to resume than to reverse.
However, bitcoin price has moved past the 100 SMA dynamic inflection point as an early indicator of a return in buying pressure. Price has also broken past the neckline around the $9200 level to signal a potential rally, which might last by around $800 or the same height as the chart formation.
Stochastic is on the move down to indicate the presence of selling pressure, though, and has some room to head south before reaching oversold levels. RSI has plenty of room to fall, so bitcoin price might follow suit. In that case, price could still form another bottom at the $8400 area.

Market Factors
Bitcoin price took hits last week on reports of increased oversight by the SEC and the shutdown of a couple of relatively small cryptocurrency exchanges in Japan. However, the return of risk-taking late in the week spurred demand for higher-yielding assets like bitcoin.
Profit-taking at the key $12,000 area of interest was also being blamed for the slide in bitcoin price. Price has even fallen through the next key level at $10,000 leading to more liquidation. If price is able to climb back above the $10,000 mark this week, it could push for another test of the $12,000 level and perhaps even break higher if sentiment remains positive.


