Bitcoin Price Key Highlights
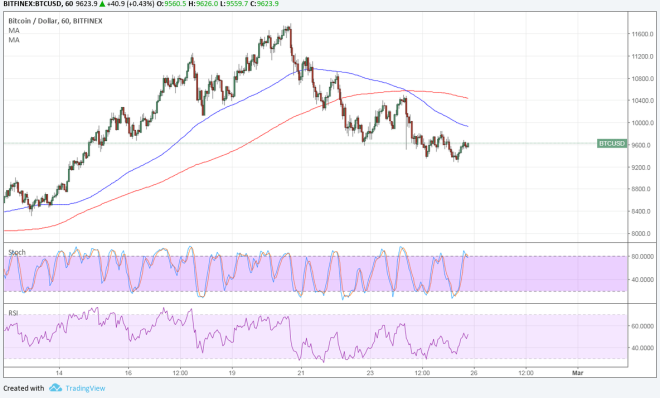
- Bitcoin price is trending lower after breaking below the neckline of its head and shoulders pattern.
- This is a classic reversal signal which indicates that price could fall by the same height as the formation, which spans around $9,500 to $11,500.
- Technical indicators are also showing that the short-term selloff could continue.
Bitcoin price confirmed a potential short-term selloff upon breaking below the neckline of its head and shoulders pattern.
Technical Indicators Signals
The 100 SMA is below the longer-term 200 SMA to indicate that the path of least resistance is to the downside or that the selloff could carry on. These moving averages could hold as dynamic resistance levels in case of corrections as well.
Stochastic is already indicating overbought conditions and might be ready to turn lower, drawing more sellers in. A break below the $9,300 level could be enough to confirm that bears are gaining traction.
However, RSI has some room to climb so bitcoin price could still attempt a larger correction. The 100 SMA is just below the $10,000 major psychologicl resistance while the 200 SMA is close to $10,500.

Market Factors
Positive sentiment in the bitcoin industry seems to have faded as traders have turned the attention to the recent charge made by the SEC on a bitcoin exchange and its founder for allegedly defrauding clients.
At the same time, dollar demand was sustained for the most part of the previous week as hawkish Fed expectations were revived. This week, the spotlight is on FOMC head Powell’s testimony as traders are eager to find out how he plans on going about tightening monetary policy from here.
Keep in mind that bitcoin price has been trading alongside riskier assets like stocks and commodities, taking advantage of risk-on flows instead of acting as a safe-haven.
In other news, Bank of America recently warned its clients about the risks of cryptocurrencies while it was reported that Austria is planning new regulations for the industry and ICOs.


Head & Shoulder… Ha! You can imagine you can see all kinds of formations when you choose different time frames. The human mind has evolved to recognize patterns even where none may exist. Price movements occur because of random events hitting the market at random times or because people are led to believe a certain “random” pattern indicates a certain price direction and they invest in that direction. It is an investment strategy that can easily go awry as new random events occur to cause a different outcome.
Attempts at day trading on smaller time frames only makes the exchanges more money in commissions and that is why they encourage it. The odds of anyone being successful at day trading is almost nil, unless you are on the floor of the exchange, or involved in pump and dump schemes.