Bitcoin Price Key Highlights
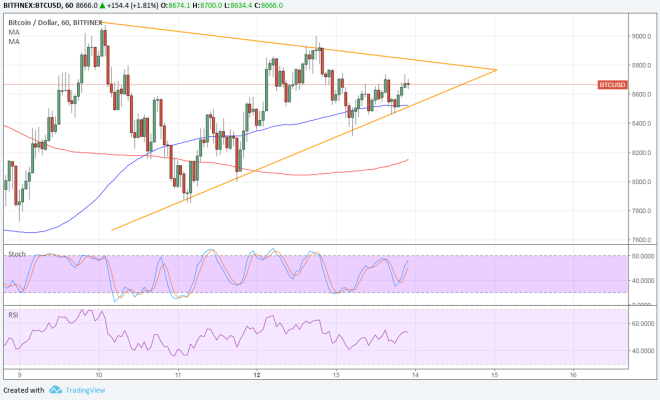
- Bitcoin price is currently consolidating, forming higher lows and lower highs inside a triangle pattern.
- Price is bouncing off support and might be due for a test of resistance soon.
- Technical indicators are also suggesting that the bounce could take place, possibly even leading to an upside break.
Bitcoin price is finding support at the bottom of its triangle consolidation and may be due for a move past the resistance if buyers are strong enough.
Technical Indicators Signals
The 100 SMA is above the longer-term 200 SMA to confirm that the path of least resistance is to the upside. This means that support is more likely to hold than to break. It could also indicate that the top of the triangle could be broken.
In addition, the 100 SMA is currently holding as dynamic support and keeping losses in check as it lines up with the triangle bottom. A break past the $8,000 level could be enough to signal a bullish break and further gains.
Stochastic is pointing up to signal that buyers are in control of bitcoin price action while RSI also seems to be turning north. However, hitting overbought levels could draw sellers back in and lead to a move back to the triangle support.

Market Factors
Equities still closed slightly in the green to confirm that risk appetite extended its stay in the financial markets. Note that bitcoin has been tracking these higher-yielding assets these days instead of taking risk-off flows.
But as mentioned, the gains were smaller this time, signaling a slowdown in momentum and a potential correction. US CPI and retail sales figures are up for release and apart from influencing USD price action, it could also have a significant impact on overall sentiment.
Other altcoins like litecoin are starting to enjoy a bit more bullish support, so it’s possible that bitcoin could follow suit. Analysts point to easing concerns about regulation as the crackdown news in South Korea are no longer hitting headlines as one of the factors propping prices up.


