Bitcoin Price Key Highlights
- Bitcoin price went on another leg lower after breaking below a short-term triangle consolidation pattern.
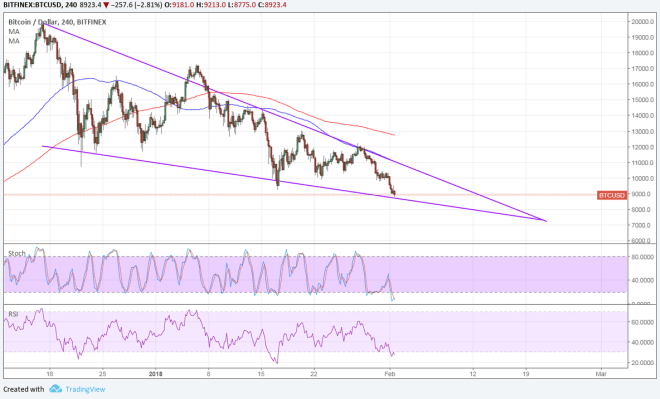
- Price is now testing another potential support at the bottom of its falling wedge pattern visible on the 4-hour time frame.
- Price could bounce off this area and make another test of the wedge resistance around the $10,000 area of interest.
Bitcoin price can’t quite catch a break as it suffered another selloff to the $9,000 handle.
Technical Indicators Signals
The 100 SMA is still below the longer-term 200 SMA to indicate that the path of least resistance is to the downside. In other words, the selloff is more likely to continue than to reverse.
In addition, the gap between the moving averages is widening to reflect stronger selling pressure, possibly leading to a wedge breakdown. Note that this chart pattern spans $9,000 to $19,000 so the resulting breakout could be of the same height.
Stochastic is indicating oversold conditions, though, which means that bears are tired and could let bulls take over bitcoin price action. RSI is also ready to pull up from the oversold level to signal a pickup in buying momentum.

Market Factors
Not even dollar weakness was enough to keep a lid on BTCUSD losses recently as negative sentiment for the cryptocurrency industry is prevailing. The lack of any positive updates is convincing more and more investors to liquidate their holdings, thereby exacerbating the selloff.
Analyst say that the increased scrutiny from regulators is still to blame for the tumble, especially since the CFTC announced plans to beef up its bitcoin futures review process. According to Chairman Giancarlo:
“The CFTC’s current product self-certification framework is consistent with public policy that encourages market-driven innovation that has made America’s listed futures markets the envy of the world. Whatever the market impact of bitcoin futures, I hope it is not to compromise the product self-certification process that has served so well for so long”.
This could involve setting “exchange large trader reporting thresholds at five bitcoins or less” and entering into “information sharing agreements with spot market platforms to allow access to trade and trader data.”


Two things. Your trend lines are not drawn across the actual lows and highs. And, most importantly, you cannot chart BTC/USD on an arithmetic scaled chart.
It yields bad information and bad calls.
why no mention that We are in a possible 3 wave down? looks like btc can end up sub 6k after the 5th wave, all possibilities, nothing set in stone
With a market soooo manipulated, with all the FUDs – and trend lines denoting only few months.. not sure how accurate this writeup is… The best part is… no one will ever know, how many more FUDs are in stock for us.
Buy when everyone is panicking. Sell when everyone gets greedy. This is a great time to be buying. Think of it as a huge coin sale. Hold for the long term, people will regret dumping btc now when it is closer to 100k then 5k. Btc and the technology behind it are not going anywhere.
Agreed. HOWEVER, keep in mind that just because it’s discounted doesn’t mean it’s not going to drop 20%, 50% or even 90%. Your best bet is to keep an eye on it and allow the panic selling to finish up and for it to hit a stable bottom and THAT is when you go all in. That, or buy in small chunks as it drops.
reminder, bitcoin (aka crypto) is the only asset that you can own which cannot be taken from you. This is not just technical trading, it is a revolution akin to ending slavery.