Bitcoin Price Key Highlights
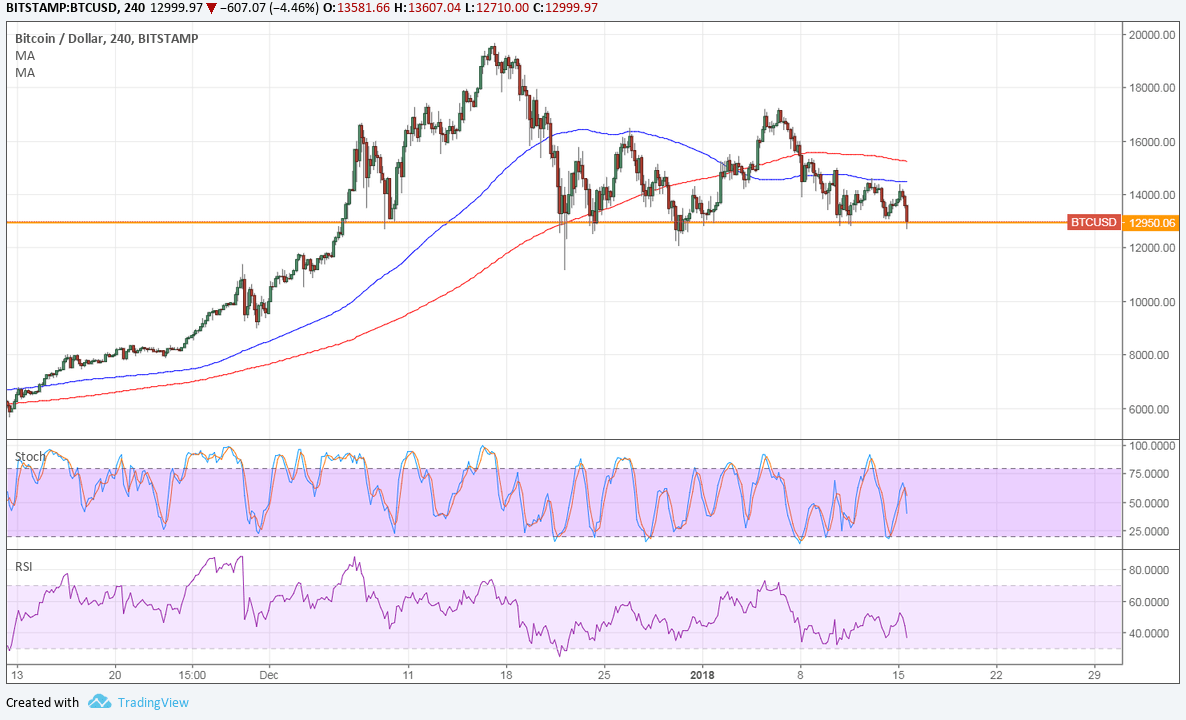
- Bitcoin price is back to testing the support of its descending triangle pattern, which also happens to be the neckline of a complex head and shoulders formation.
- A break below this $13,000 area could lead to a drop of around $6,000 or the same height as the chart formations.
- A bounce, on the other hand, could keep the consolidation going.
Bitcoin price is making another attempt to break below the support at $13,000 and doing so would mark the start of a longer-term drop.
Technical Indicators Signals
The 100 SMA is below the longer-term 200 SMA to signal that the path of least resistance is to the downside. This means that the selloff is more likely to resume than to reverse. The 100 SMA also appears to be holding as dynamic resistance as well.
Stochastic is pointing down to show that sellers are regaining the upper hand. RSI is on the move south, so bitcoin price could follow suit. The next visible area of interest on the 4-hour time frame is around the $9,000 level.

Market Factors
More headlines on South Korea’s plans to stop bitcoin trading in the country are leading investors to liquidate their long positions in anticipation of lower volumes and activity down the line.
Some statements indicated that the government simply wants to remove anonymity in transactions, leading some to believe that bitcoin trading could carry on. A statement from Shinhan Bank, however, signaled that it does not intend to introduce an identity verification service for deposits and withdrawals from virtual bank accounts:
“We’ve developed a system to introduce identifying virtual account customers in accordance with the government’s efforts to curb the cryptocurrency craze. However, we decided to scrap the service enabling the trade of digital tokens which has become a serious social issue.”
So far, several politicians and citizens have signed petitions to demand that the government step back from adopting the measure.


This FUD shit again? Fuck off. I’m still buying on this dip.