Bitcoin Price Key Highlights
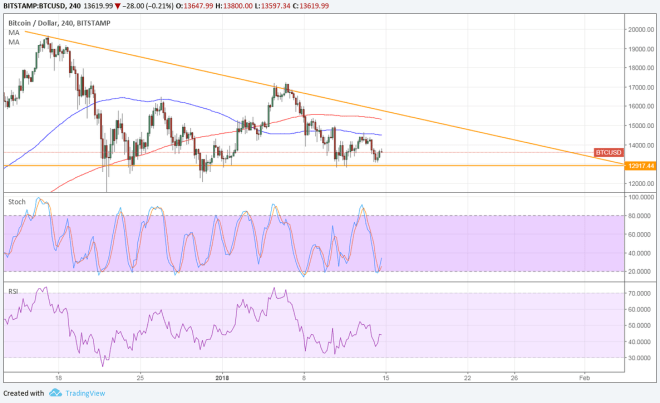
- Bitcoin price continues to tread sideways and is still hovering around the bottom of its descending triangle on the 4-hour chart.
- Price looks ready for a bounce off support as a double bottom is forming.
- Bitcoin has yet to break past the small reversal pattern’s neckline around $14,000 before confirming the climb.
Bitcoin price can’t quite seem to gain bullish momentum to climb up to the triangle resistance, but buyers are still defending support.
Technical Indicators Signals
The 100 SMA is below the longer-term 200 SMA to show that the path of least resistance is to the downside. In other words, the bottom of the triangle is more likely to break than to hold.
Stochastic is turning higher, though, so bulls could still regain control of bitcoin price and push it back up for a test of the triangle resistance at $15,000. This is also close to the 200 SMA dynamic inflection point, which might hold as resistance.
RSI is also on the move up to indicate that buyers have the upper hand. However, if both oscillators hit overbought levels and turn back down soon, sellers could make another attempt at pushing bitcoin price below the triangle support at $13,000. Note that the triangle is around $6,000 tall so the resulting drop could be of the same height.

Market Factors
Dollar demand has once again picked up late last week when US CPI and retail sales came in mostly in stronger than expected. Headline CPI came in line with estimates of a 0.1% uptick while the core reading beat expectations with a 0.3% gain versus the estimated 0.2% increase.
As for bitcoin price itself, this particular cryptocurrency seems to be losing ground to its altcoin rivals on the lack of volatility. Alternative digital currencies are offering higher potential returns and are much cheaper, after all.
Besides, the crackdown in China and South Korea is once again threatening volumes and global activity in bitcoin.


