Bitcoin Price Key Highlights
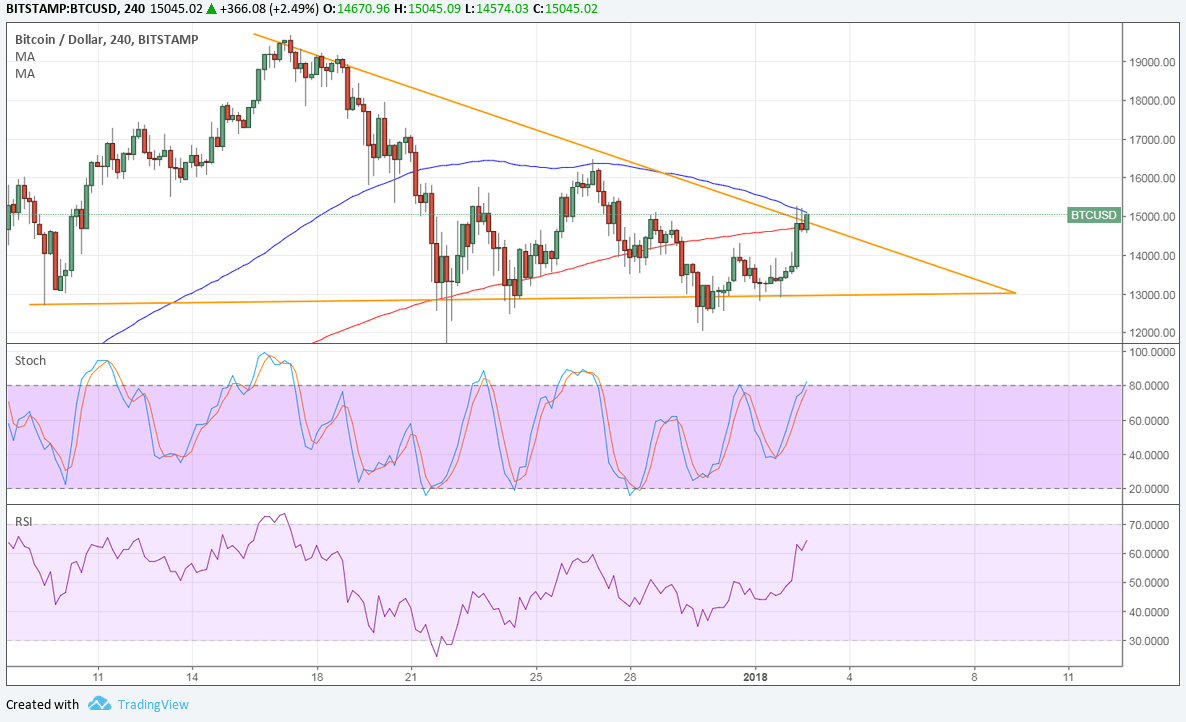
- Bitcoin price has formed lower highs and found support around $13,000, creating a descending triangle pattern.
- Price is currently testing the triangle resistance and might be ready for an upside breakout.
- Technical indicators, however, are signaling that the resistance levels might hold.
Bitcoin price is testing the descending triangle resistance on its 4-hour chart but could slump back to support.
Technical Indicators Signals
The 100 SMA is still above the longer-term 200 SMA on this time frame, so the path of least resistance is to the upside. This means that the rally is more likely to resume than to reverse.
However, the gap between the moving averages is narrowing to suggest weakening bullish momentum. In addition, the 100 SMA lines up with the top of the triangle and appears to be holding as near-term resistance. In that case, bitcoin price could fall back to the bottom of the pattern.
Stochastic is heading north to show that there is some bullish energy left, but the oscillator is nearing overbought levels and could be due to turn back down. RSI is also on the move up but approaching overbought territory, so bullish momentum could weaken and allow bears to take over.
If selling pressure is strong enough, price could break below the triangle support and fall by around $700 or the same height as the formation. An upside breakout from $15,000 could encounter resistance at the record highs near $20,000.

Market Factors
The US dollar is starting the year off on weak footing as doubts on the Fed’s tightening track remain. Bitcoin price seems to be taking advantage of this weakness and the fact that the recent network upgrades have been a success.
Its rivals such as bitcoin cash are encountering some setbacks, rendering the core version superior. However, the South Korean government’s push for increased regulation could curb bitcoin activity in the country, which is actually one of the top markets of the cryptocurrency.


