Reason to trust

How Our News is Made
Strict editorial policy that focuses on accuracy, relevance, and impartiality
Ad discliamer
Morbi pretium leo et nisl aliquam mollis. Quisque arcu lorem, ultricies quis pellentesque nec, ullamcorper eu odio.
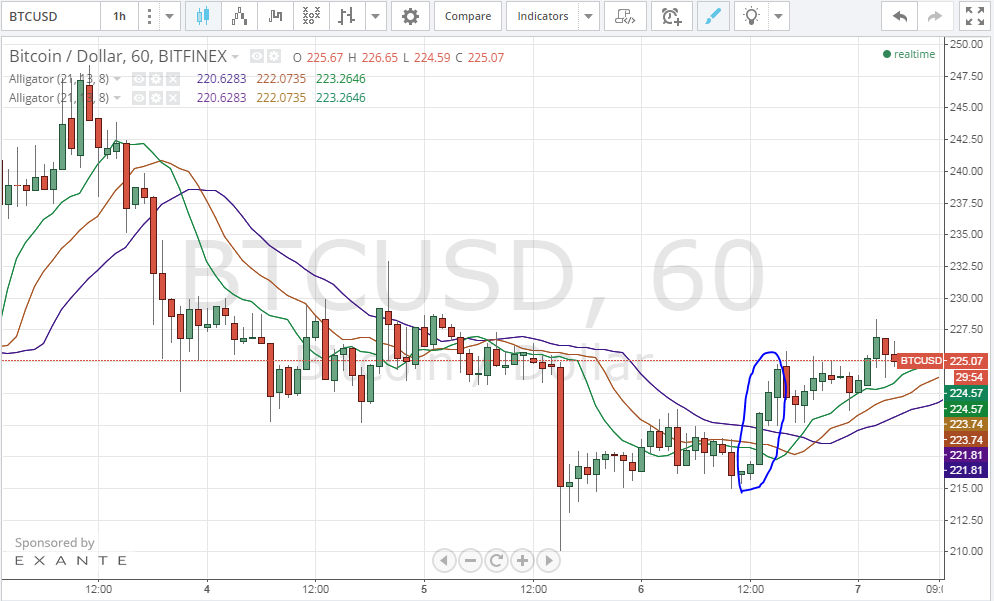
Bitcoin price stopped falling today and started increasing from around $214 to $228. A reversal in the downtrend that was prominent yesterday, as the price approached $200, can signal a bullish rally that has the momentum to drive the price up to even higher levels.
By studying the 1 hour Bitfinex (BTC/USD) charts from tradingview.com (look at the below chart), we can notice that bitcoin price stopped falling today and started rising to reach a high of around $228.40. Cessation of yesterday’s downtrend endorses the fact that the price is well supported around the $220 level, as per our previous analysis, which resisted further drop before reversing the bearish wave. The bullish wave is building up and will likely continue for a few days, as shown by the 5 successive bullish green candles on the 1 hour charts (look at the 5 candles inside the blue cloud on the below chart).
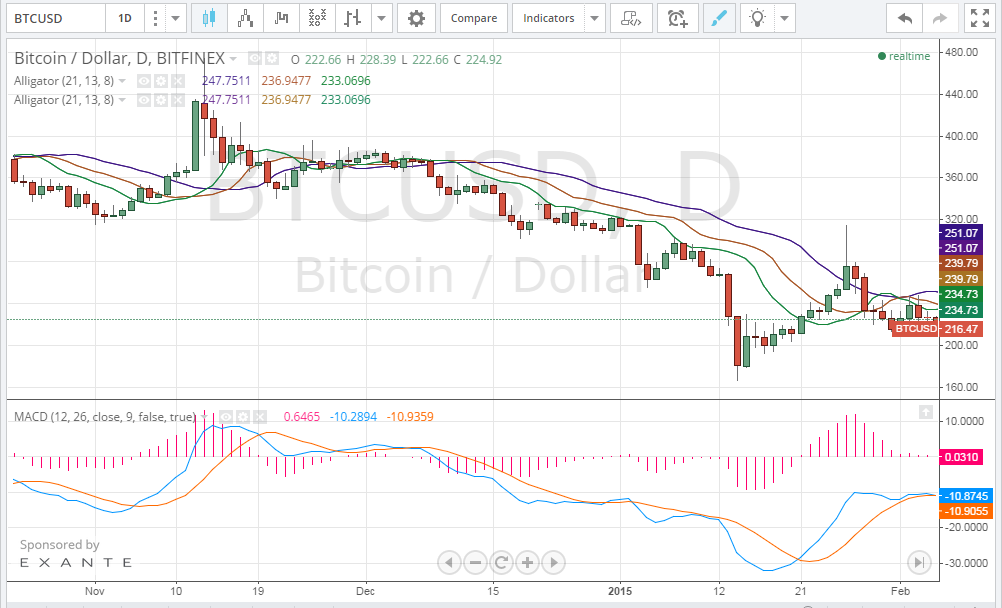
By plotting the MACD curve on the 1 day Bitfinex (BTC/USD) charts from tradingview.com (look at the below chart), we can see that the MACD value is still in the negative territory. The value of MACD should jump into the positive territory before the bullish wave could become strong enough to push the price up to test the $256 resistance level. However, the blue MACD line is above the red signal line, which is in favor of continuation of the bullish wave, despite the fact that the gap between the 2 lines is quite narrow. It is also expected to see the MACD blue line steeping in an upward direction before we can see an even stronger bullish rally.
Conclusion:
Bitcoin price stopped falling today as the $220 level is supporting the price well. As the bullish wave is building up, we can soon see the price rising up to test the $256 resistance level.


