Reason to trust

How Our News is Made
Strict editorial policy that focuses on accuracy, relevance, and impartiality
Ad discliamer
Morbi pretium leo et nisl aliquam mollis. Quisque arcu lorem, ultricies quis pellentesque nec, ullamcorper eu odio.
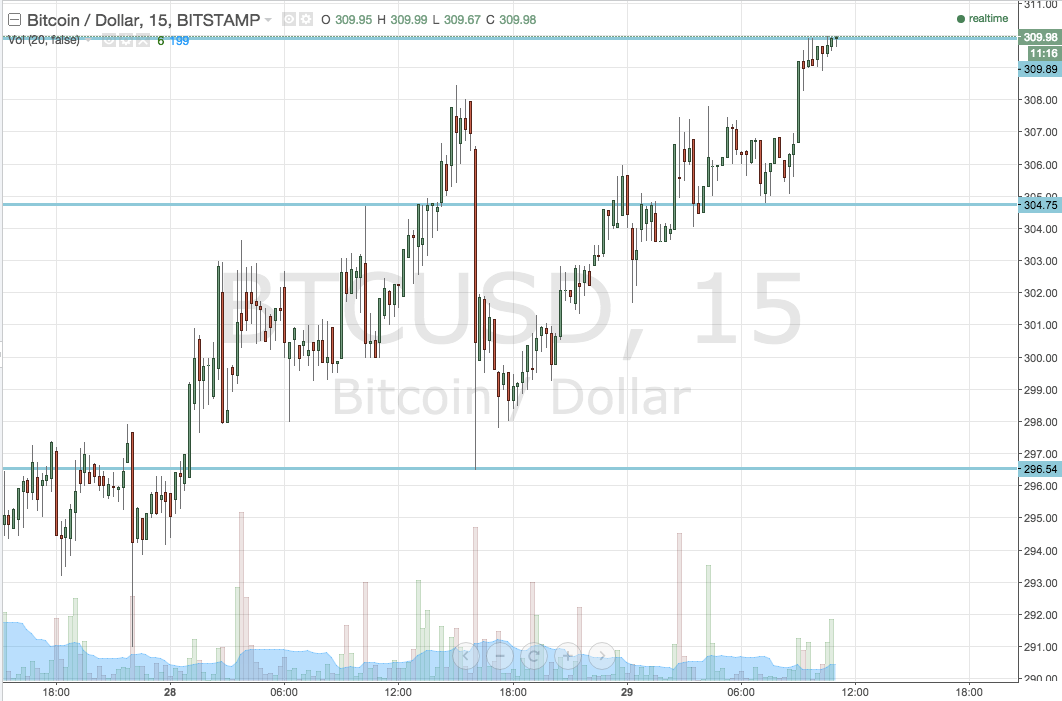
Late last night, when we published the second of our twice daily bitcoin price watch pieces, the market was hovering around the $300 mark. Action has now matured across the Asian session, and we are heading into a fresh European session today. As we head into the session, where is the bitcoin price currently trading, what happened overnight, and how has the Asian session influenced our strategy for today’s session? Take a quick look at the chart to get an idea of what we’re watching.

As the chart shows, the levels in focus for todays session are in term support at 304.75 and in term resistance at 309.89, the the downside and the upside respectively. We’ve got a reasonably tight range in play today, so we will stick with our standard breakout strategy rather than bring our intrarange into the equation.
Initially, we will look for a break above in term resistance, alongside a close above that level, to validate a medium term upside bias and put us in a long trade towards an upside target of 312 flat. A stop on this one somewhere around 308 flat will ensure we get taken out of the trade in the event of a bias reversal and don’t get caught out on the wrong side of a steep decline.
Looking the other way, if we get a break below in term support at 304.75, we will watch for a close below this level on the intraday chart to put us in a slightly longer term short trade towards a target of 296.54. We will probably get some friction around 300 flat, since this is psychological support, but if we break it we should easily see a run down towards our take profit. Again a stop loss is necessary, and we’ve got a little bit more room to play with here – somewhere around 307 should do the trick.
Charts courtesy of Trading View


