
Reason to trust
How Our News is Made
Strict editorial policy that focuses on accuracy, relevance, and impartiality
Ad discliamer
Morbi pretium leo et nisl aliquam mollis. Quisque arcu lorem, ultricies quis pellentesque nec, ullamcorper eu odio.
Bitcoin price skyrocketed earlier today to print a high of around $370. Just like we predicted along yesterday’s analysis, bitcoin price soared right after bypassing the resistance level at $330.1. The price surged to breach the resistance at $350, before dropping below it as bitcoin is now trading at $347.
New Uptrend On The 1 Hour Charts:
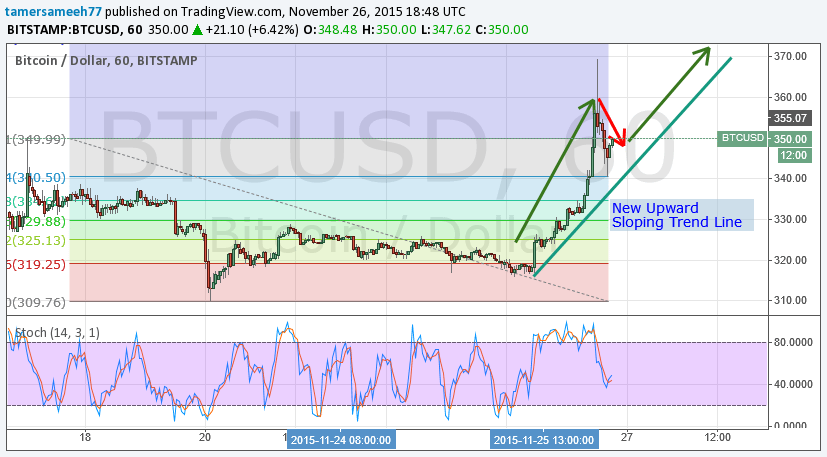
Let’s examine the 1 hour (BTC/USD) charts from Bitstamp (look at the below chart). We will keep the Fibonacci retracements we plotted during yesterday’s analysis and execute the stochastic oscillator. We can note the following:
- After the Elliot bearish supercycle was completed, bitcoin price started to rise, bypassing the resistance at the 50% Fibonacci retracement level. A few hours later, the price surged to breach the resistance at $350 and continued rising to a high of $370, yet the market’s buying power wasn’t strong enough to support the price at that level, which led to price drop below that crucial resistance level.
- We can now spot a new upwards sloping trend line forming since yesterday’s price surge. As shown by the blue trend line on the below chart, a bullish wave (green arrow) was followed by a bearish correction wave (red arrow) and we can expect price to rise again during the next few hours to test the resistance at $350.
- If bitcoin price settles above $350 within the next few hours, we can see it rise to test the resistance at $370 within the next 24-48 hours.
- The stochastic oscillator value has dropped to 46 as compared to yesterday’s value of 94, so investing in long positions now can have a convenient risk/reward ratio with take profit set at $350 and $370, with a stop loss of $330.
Is This a Rubber Band Effect?
The “Rubber band effect” is a Wall Street term that refers to bouncing of the price of a stock after a large market sell-off, so is this price surge a “rubber band effect”? I would love to know your thoughts on this.
Conclusion:
Bitcoin price soared earlier today to print a high of $370; however, the bulls didn’t manage to keep the price above the $350 level. The stochastic indicator is at a value that is in favor of a further rise that can take bitcoin price to test the resistance at $370 within the next 24-48 hours.
Charts from Bitstamp, hosted on Tradingview.com


