
Reason to trust
How Our News is Made
Strict editorial policy that focuses on accuracy, relevance, and impartiality
Ad discliamer
Morbi pretium leo et nisl aliquam mollis. Quisque arcu lorem, ultricies quis pellentesque nec, ullamcorper eu odio.
Bitcoin price gained bullish momentum and cleared the $38,000 resistance against the US Dollar. BTC could correct lower, but the bulls are likely to remain active above $37,200.
- Bitcoin extended its rise and it even cleared the $38,000 resistance (as discussed yesterday).
- The price is now trading above $37,500 and the 100 hourly simple moving average.
- There are two major bullish trend lines forming with support near $37,200 and $36,000 on the hourly chart of the BTC/USD pair (data feed from Kraken).
- The pair could correct a few points, but the bulls are likely to protect strong dips below $37,000.
Bitcoin Price is Up 5%
Yesterday, we discussed high chances of a move towards the $38,000 resistance in bitcoin price. BTC did follow a bullish path above the $36,000 level and it cleared many hurdles near $37,000.
It even broke the $38,000 resistance and settled nicely above the 100 hourly simple moving average. It seems like the market sentiment improved after Ethereum traded to a new all-time high near $1,700. BTC also traded to a new monthly high at $38,342 and it is currently consolidating gains.
An initial support on the downside is near the $37,650 level. It is close to the 23.6% Fib retracement level recent upward move from the $35,592 swing low to $38,342 high.
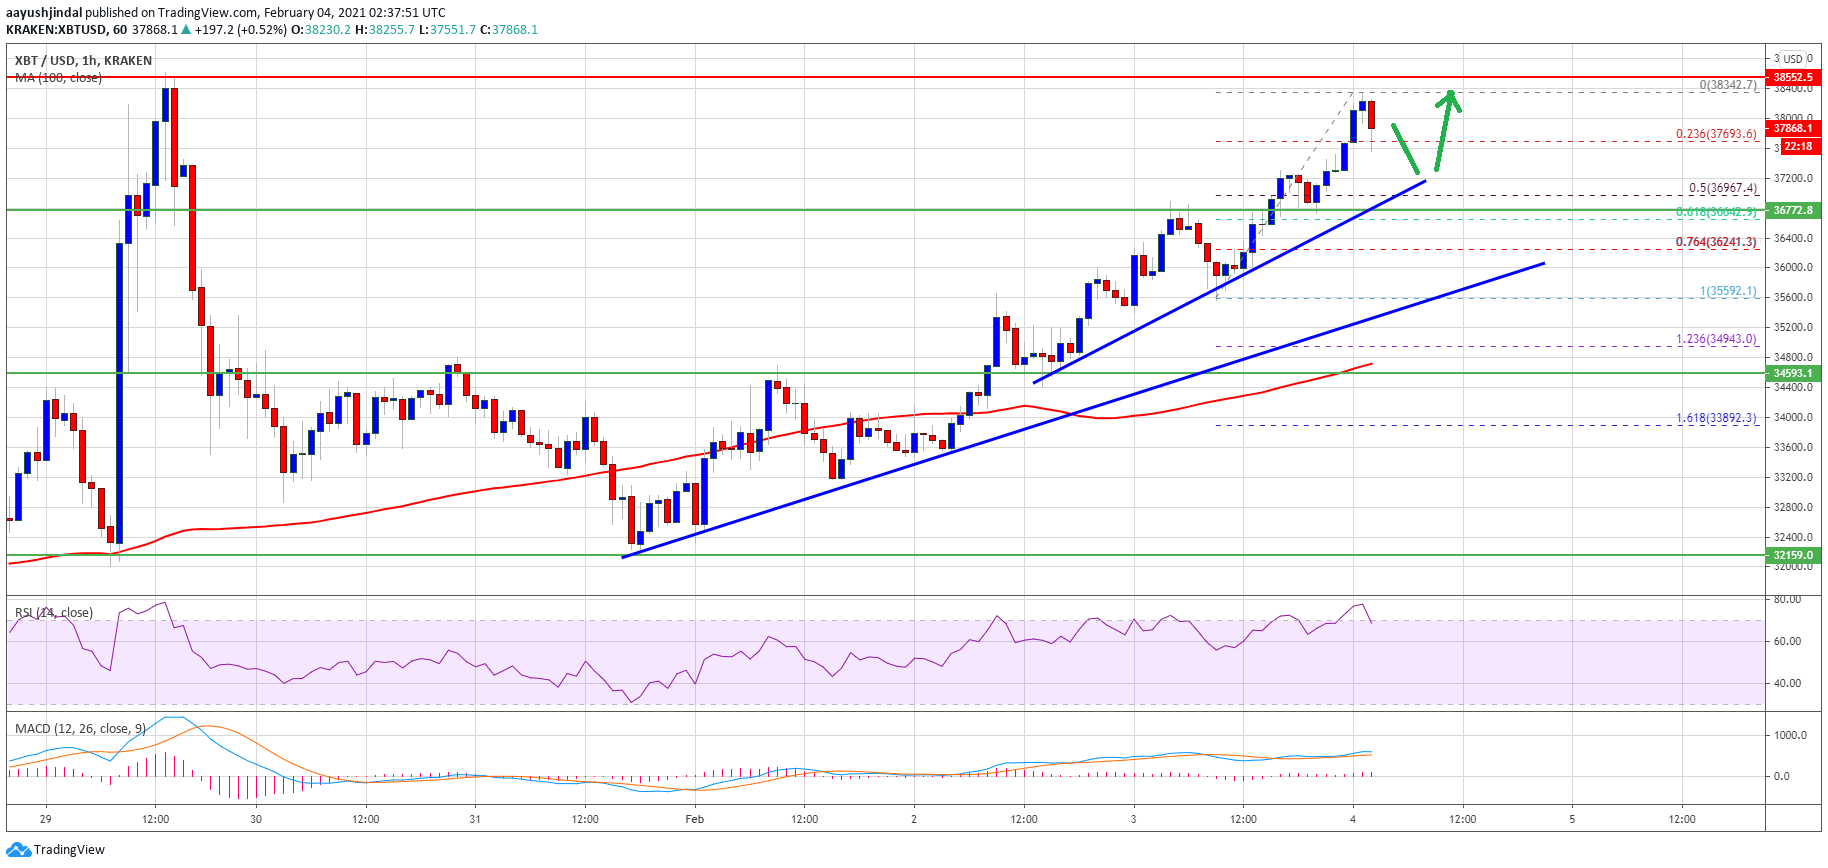
Source: BTCUSD on TradingView.com
There are also two major bullish trend lines forming with support near $37,200 and $36,000 on the hourly chart of the BTC/USD pair. The first trend line is close to the 50% Fib retracement level recent upward move from the $35,592 swing low to $38,342 high.
On the upside, the price is facing hurdles near the $38,100 and $38,200 levels. If there is a clear break above the $38,200 level and the recent higher, the bulls are likely to aim a test of the $40,000 level in the near term.
Dips Supported in BTC?
If bitcoin fails to clear the $38,200 resistance zone, it could correct lower in the short term. The first major support is near the $37,200 level and the trend line.
The next key support is near the $36,700 level (a multi-touch zone). Any more losses could lead the price towards the second bullish trend line at $36,000 in the near term.
Technical indicators:
Hourly MACD – The MACD is gaining momentum in the bullish zone.
Hourly RSI (Relative Strength Index) – The RSI for BTC/USD is now well above the 60 level.
Major Support Levels – $37,200, followed by $36,700.
Major Resistance Levels – $38,100, $38,200 and $39,500.


