
Reason to trust
How Our News is Made
Strict editorial policy that focuses on accuracy, relevance, and impartiality
Ad discliamer
Morbi pretium leo et nisl aliquam mollis. Quisque arcu lorem, ultricies quis pellentesque nec, ullamcorper eu odio.
- There were continuing gains in bitcoin price above the $13,000 resistance against the US Dollar.
- The price traded close to the $14,000 level and later started a sharp bearish correction.
- There is a key breakout pattern forming with resistance near $12,950 on the hourly chart of the BTC/USD pair (data feed from Kraken).
- The pair is likely to remain supported and it could climb higher once again above the $13,000 barrier.
Bitcoin price is trading nicely above the $11,500 and $12,200 support levels against the US Dollar. BTC price is currently consolidating and seems to be preparing for the next break.
Bitcoin Price Analysis
Yesterday, there was a sharp increase in bitcoin above the $12,000 target against the US Dollar. The BTC/USD pair even broke the key $13,000 barrier and settled well above the 100 hourly simple moving average. Finally, there was a solid run towards the $14,000 level. A new 2019 high was formed near $13,857 before the price started a short term bearish correction.
There was a sharp dip in bitcoin below the $13,000 and $12,400 support levels. Moreover, there was a break below the $12,000 pivot level and the price traded close to the 100 hourly simple moving average. However, the $11,550 level acted as a strong support. Besides, the price stayed nicely above a major bullish trend line with support at $11,850 on the hourly chart.
BTC is currently correcting higher and is trading above $12,250. It settled above the $12,000 pivot level and traded above the 50% Fib retracement level of the last decline from the $13,857 swing high to $11,539 low. There was a spike above the $13,000 level, but the $13,300 level acted as a resistance. Moreover, the 76.4% Fib retracement level of the last decline from the $13,857 swing high to $11,539 low acted as a hurdle.
At the outset, there is a key breakout pattern forming with resistance near $12,950 on the hourly chart of the BTC/USD pair. If there is an upside break, the price might start a fresh increase towards $13,000 and $14,000 in the near term. If not, there is a risk of another drop towards the $12,000 or $11,850 support before a fresh increase.
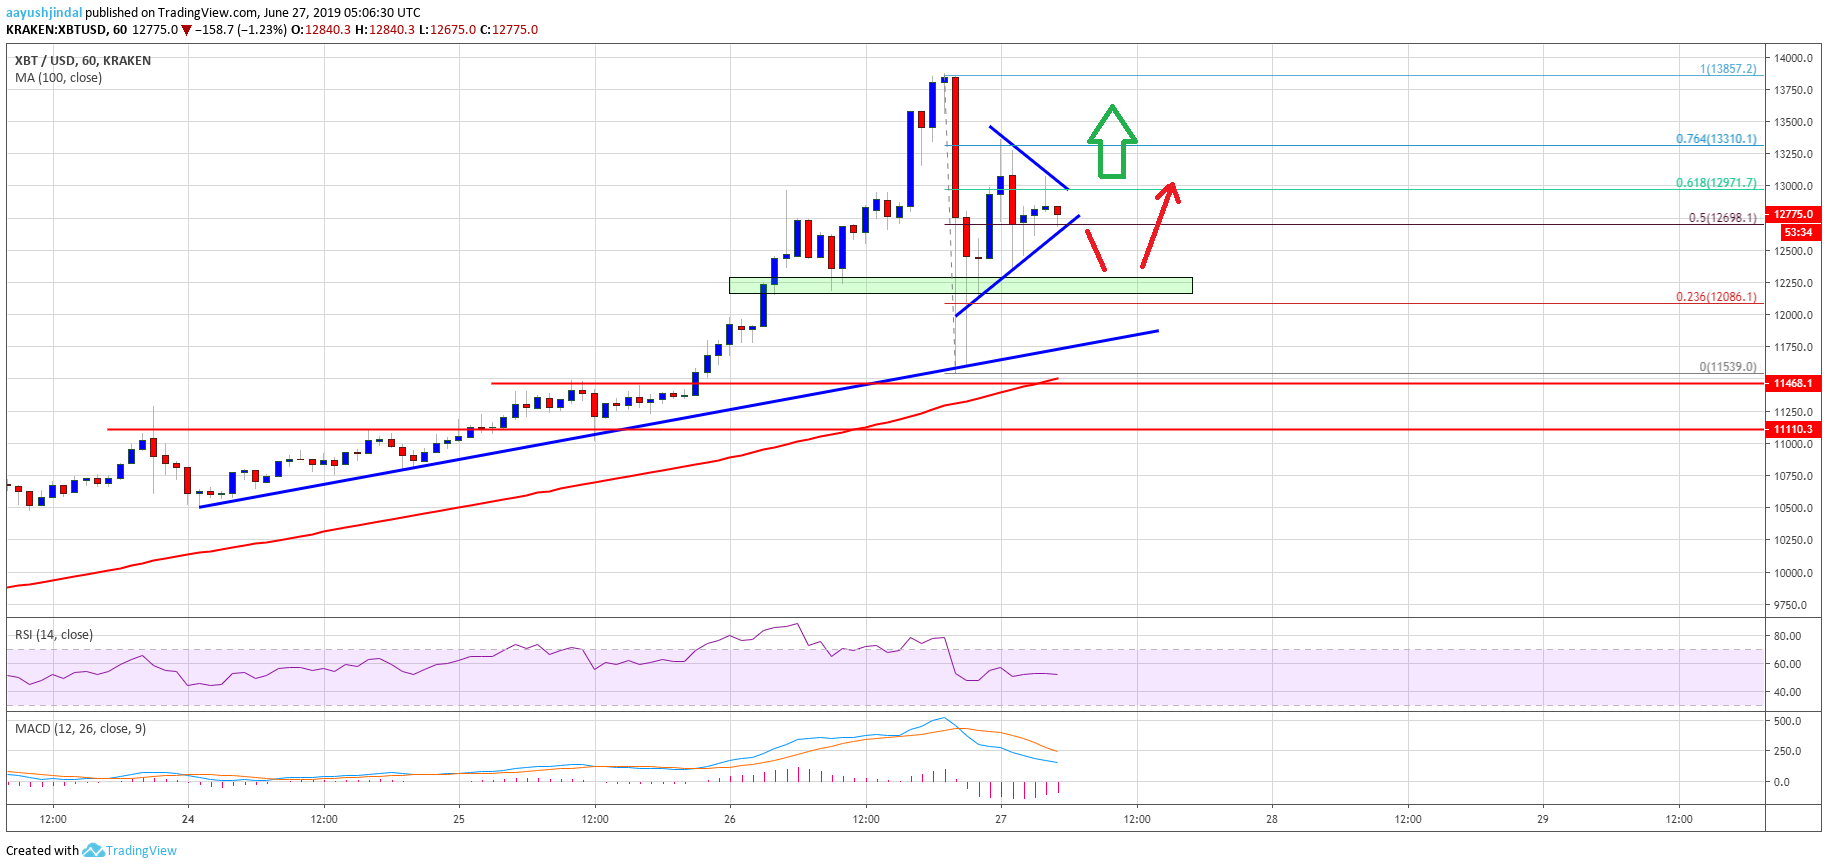
Looking at the chart, bitcoin price is clearly correcting recent gains and is trading above the $12,000 pivot level. As long as there is no daily close below $11,500, the price remains well supported for more gains.
Technical indicators:
Hourly MACD – The MACD is currently losing momentum in the bearish zone.
Hourly RSI (Relative Strength Index) – The RSI for BTC/USD is just below the 50 level, with a bearish angle.
Major Support Levels – $12,200 followed by $12,000.
Major Resistance Levels – $13,000, $13,300 and $13,800.


