Reason to trust

How Our News is Made
Strict editorial policy that focuses on accuracy, relevance, and impartiality
Ad discliamer
Morbi pretium leo et nisl aliquam mollis. Quisque arcu lorem, ultricies quis pellentesque nec, ullamcorper eu odio.
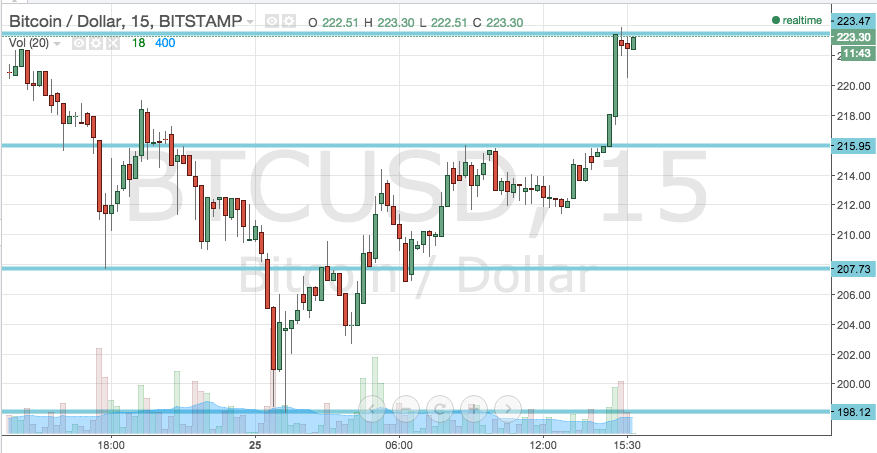
In this morning’s bitcoin price watch piece we highlighted the levels that we were keeping an eye on in the bitcoin market, and attempted to make sense of the wider action in the financial asset markets. Further we tried to determine the implications of these wider market movements for the near term of the bitcoin price moving forward. Action has now matured to a close on the European session, and as we head into an Asian evening, what are the levels we are watching now, and where can we look to get in and out of the markets according to our intraday breakout strategy? Take a look at the chart.

As you can see, having broken through the level we had stated as in term resistance earlier today, we quickly ran up towards the level we were watching as a medium term target. This was a nice long trade, and helps us to define our parameters this evening.
If we can get a strong break above 223.47 (new in term resistance) and a close above this level on the intraday chart, we will look to entry long towards a medium term target of 228 flat. Beyond that, 230 will come into play. On this trade, a stop loss somewhere around 221 flat will help us to maintain a positive risk reward profile.
Looking the other way – a break below in term support at 215.95 will put us short towards 207.73. Again a stop loss is warranted, with somewhere around 218 keeps things attractive from a risk management perspective.
Charts courtesy of Trading View


Still learning how to trade Bitcoin, but now yet clear on the terminology. What is considered “the intraday chart”? What time period does it cover? Also what time interval do you typically set your candles at?
He doesn’t. It’s all just sooth saying.
I was a bitcoins supporter (I even interned at a bitcoin start up) but I just don’t see it bouncing back.
Nothing more than some exchanges pulling some shady fake volume to inflate the price ala mt gox, big crash soon to follow.
“temporarily” how do you know if its “temporarily” dickhead.