Reason to trust

How Our News is Made
Strict editorial policy that focuses on accuracy, relevance, and impartiality
Ad discliamer
Morbi pretium leo et nisl aliquam mollis. Quisque arcu lorem, ultricies quis pellentesque nec, ullamcorper eu odio.
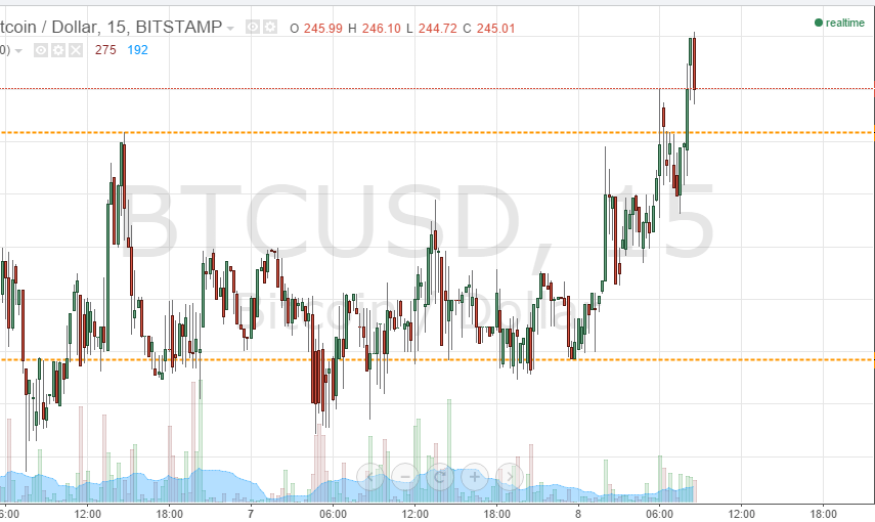
For the first time in a number of weeks, action in the bitcoin price came during the European session rather than the Asian overnight session. Yesterday’s market saw a sharp increase in the price of bitcoin from lows of around $223 to intraday highs of $231, and – from these levels – the bitcoin price has ranged between relatively tight parameters to bring us to this morning’s session. So, with this said, what are the levels that we are watching in the bitcoin price today, will we get another movement like we saw yesterday, and if so, can we get in and out of the markets according to our intraday strategy to try and take advantage from the volatility. Take a quick look at the chart.

As you can see, the chart outlines today’s parameters – 228.2 to serves as in term support and 231.97 (already mentioned overnight highs) brings us in term resistance). These are the two levels that we will be watching during today’s session.
If we get a break back above 231.97, it will put us long towards a medium-term target of 235 flat. On this trade, a stop loss somewhere around 230 flat should keep things attractive from a risk management perspective.
Looking the other way, a break below 228.2 to would initially bring 225 into play as a short-term downside target (scalp) and beyond that, 223.13. A stop loss somewhere around the same levels as on the long trade – 230 flat – keep things positive on this one.
As a side note, today’s range is likely to tight to incorporate an intra-range strategy – with only about two or three dollars’ worth of reward available the likelihood of us getting chopped out is too high to make it effective.
Charts courtesy of Trading View


