Reason to trust

How Our News is Made
Strict editorial policy that focuses on accuracy, relevance, and impartiality
Ad discliamer
Morbi pretium leo et nisl aliquam mollis. Quisque arcu lorem, ultricies quis pellentesque nec, ullamcorper eu odio.
Bitcoin price has just scored a high of $412.41 on Bitstamp less than an hour ago. As we predicted yesterday, the new bullish wave is continuing to control the market and is pushing bitcoin price steadily towards the next resistance level at $416.
Predicting Possible Price Correction Thresholds:
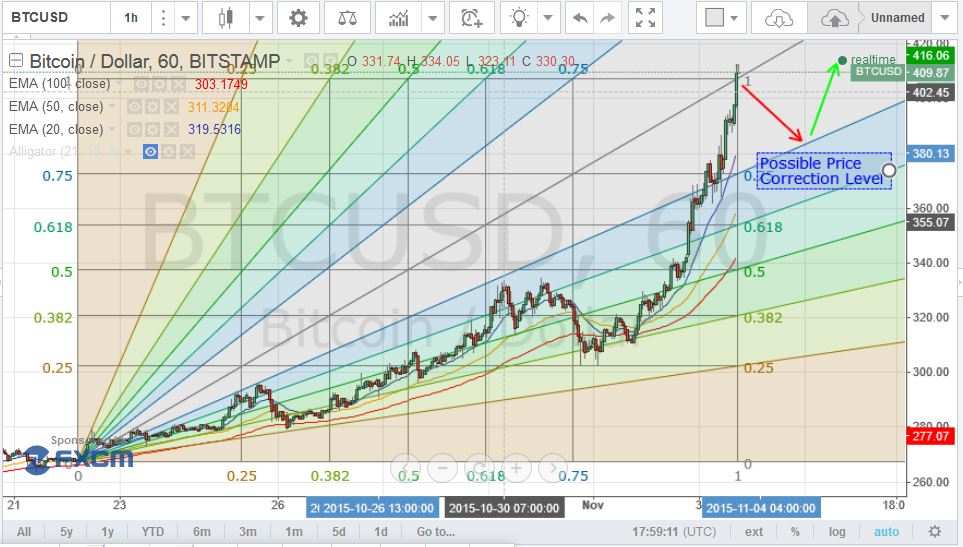
Via studying the 1 hour (BTC/USD) from Bitstamp (look at the below chart), plotting the 20, 50 and 100 EMAs and executing a Fibonacci resistance fan that spans between the low scored on the 22th of October ($266) and the high scored earlier today ($412.41), we can notice the following:
- The price is still way higher than the 20, 50 and 100 EMAs, which reflects the market’s buying power and so long as it remains this way, we can expect it to test the $416 resistance level within the next few hours.
- As per the Fibonacci resistance fan that we executed, we can see that the price is always supported by the fan levels whenever price correction attempts to pull the price down, as it has been supported by the 0.382 fan level which prevented further price drop last Sunday (look at the below chart). Accordingly, we expect the price correction wave to pull the price down to around $386, which corresponds to the 0.75 fan level, which will prevent further price drop.

Is the Market Overbought As Denoted By The 1 Day Charts?
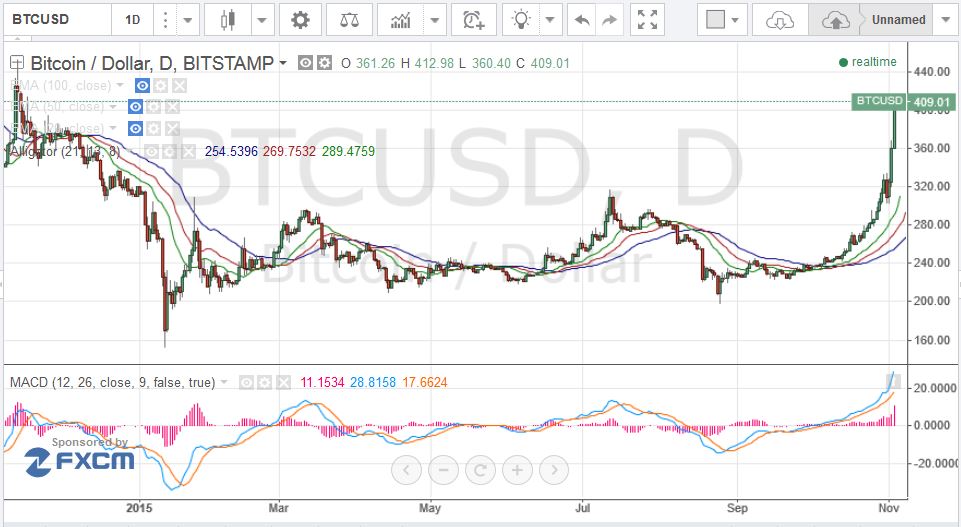
By examining the 1 day (BTC/USD) charts from Bitstamp; plotting William’s Alligator Indicator and executing the MACD (look at the below chart), we can notice the following:
- The MACD is still confirming the continuation of the current uptrend as we can still see it traveling in the positive zone with the blue uptrend line above the red downtrend line, so no signs of an overbought market can be observed using the MACD.
- The alignment of the William’s Alligator averages are still in favor of continuation of the current uptrend, with the green trend line above the red trend line and both are on top of the blue trend line.

Conclusion:
Bitcoin price is continuing to print higher highs and it is rising on its way to test the $416 resistance level, which is likely to happen within the next few hours. Although a price correction downwards wave can halt the bullish rally for some time, our analysis didn’t find evidence of stoppage of the bullish wave soon.
Charts from Bitstamp; hosted by Tradingview.com


n00b question: at the time of this article, didn’t the RSI value (which you referenced in the subsequent LiteCoin article) contradict the MACD/WAI patterns and indicate that BTC is overbought? Why not use that?
Yes, I agree but you don’t always use all the indicators or
oscillators, you only use the ones that you need to prove or disprove a
certain market pattern. Bitcoin might seem overbought via some
indicators and this is true in a certain way, because the price will
correct itself during the next 48 hours or so.
You can’t talk without being impolite can you? You are the only silly one here; filled with paranoid delusions.
Extremely precise prediction (and the previous one too)! What’s coming next?
The $416 resistance level is being tested now as I reply to your comment; if this level is breached, we can see the price heading towards the next resistance at $478 which corresponds to the Fib 61.8% retracement level, yet we will have to wait and examine the hourly charts during the next few hours to spot the anticipated downwards price correction attempt. Thanks for following my analysis and I hope it is helpful!
Hi Tamer, is it possible to get an update since we hit $500 today?
Sorry, I have just read your message, yet I believe that the price will settle above $390 within the next 24 hours or so. Please accept my apology again for the late reply and thanks for stopping by. do you own or run bitcoinfundme.com? can you please add me on LinkedIN and/or Facebook?
Hello do you own or run bitcoinfundme.com? can you please add me on LinkedIN and/or Facebook?