Reason to trust

How Our News is Made
Strict editorial policy that focuses on accuracy, relevance, and impartiality
Ad discliamer
Morbi pretium leo et nisl aliquam mollis. Quisque arcu lorem, ultricies quis pellentesque nec, ullamcorper eu odio.
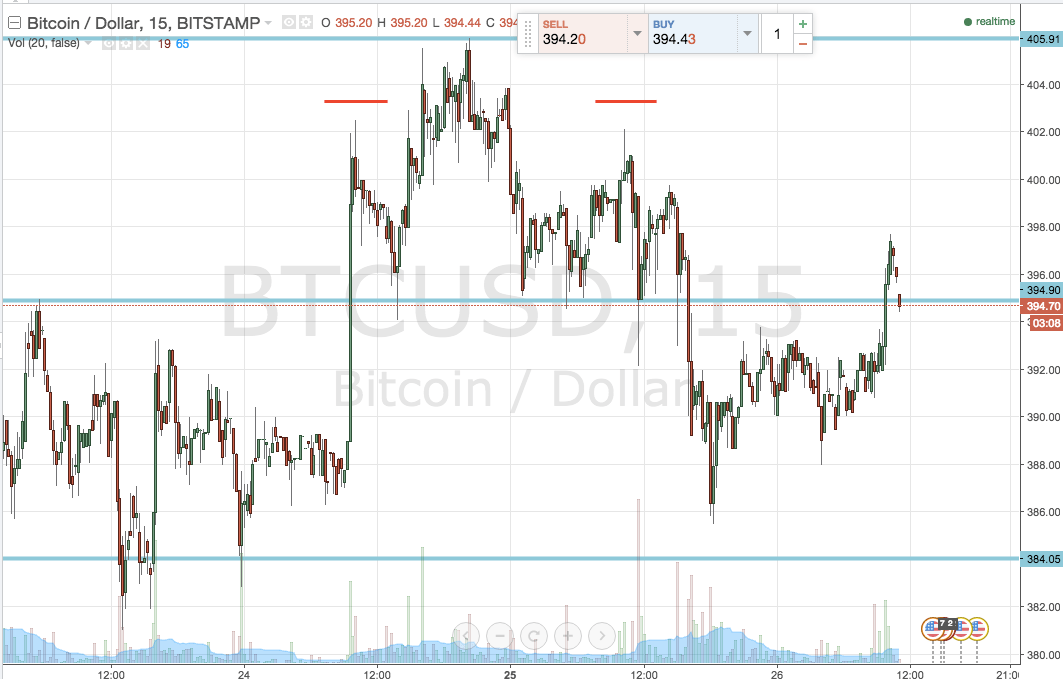
So yesterday we ran into a bit of bad luck. In Monday’s intraday analysis, we spent the majority of our time discussing the head and shoulders pattern that was forming (if you’re not familiar with the pattern, take a quick look at yesterday’s article here) and the implications of a pattern validation on the bitcoin price going forward. Specifically, we suggested that a breaking of the pattern’s neckline, which we slated as 395.9 flat, would validate a short position towards a target equal to the distance between its peak and the entry level – giving us a target somewhere in the region of $385-5. I’ve added an extra chart into today’s analysis – one that shows yesterday’s action and has the pattern highlighted, to illustrate why it was an unlucky day for us. Take a look below.

As you can see, we broke clean through the neckline just after we reported our views, and immediately ran down towards what looked like it would be a nice target hit and – in turn – a profit drawn from the market. As it turned out, we reached lows of 385.5 – less than a dollar from our target – and reversed to the upside. A little earlier today, the bitcoin price traded back above our entry and took out our stop for a small loss.
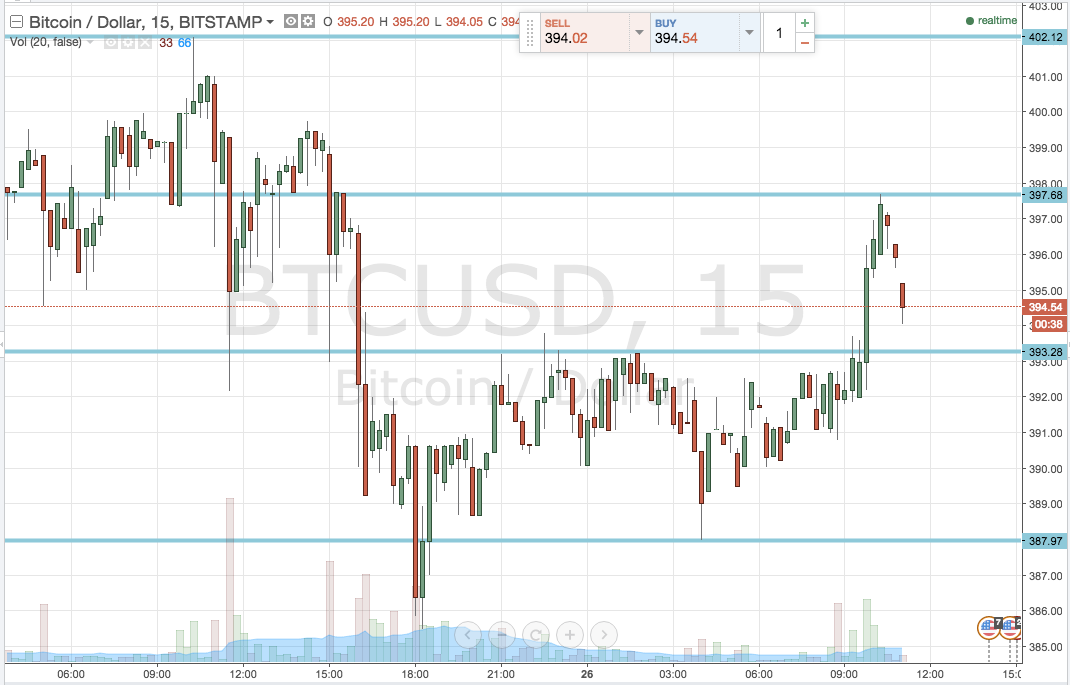
Let’s not dwell on the past, however. Heading into today’s European afternoon, there looks to be plenty of opportunity to draw a profit from the market and make back our stop on yesterday’s failed efforts. We’ve got a nicely defined range, some volatility, and what looks to be pretty decent volume. With the right fundamental catalyst and some well placed targets (lets see if we can get it right this time!), we should have no problem getting things back on track. So, with his said, let’s have a look at what we’re watching. Take a quick look at the second chart to get an idea of our range.

As the chart shows, today’s range is defined by in term support at 393.28, and in term resistance at the most recent swing high – 397.68. I’m aware this is just below 400 flat, so a break may initially give some friction to the upside, but if we get through resistance I believe the bitcoin price should have no problem breaking and clearing the psychologically significant 400 mark.
Now to positions. If we close below in term support, it will give us a short signal with a downside target of 388 flat – overnight lows. To define our risk, a stop on this short entry somewhere in the region of current levels – circa 395 – keeps things tight.
Looking the other way, a close above in term resistance will put us long towards an upside target of 402 flat. This is a pretty tight scalp trade, especially when compared to yesterday’s aggressive target, and we’ve got to allow our stop placement to reflect this. A stop loss around 396 looks to work well, as this gives us a little bit of wriggle room yet still keeps the trade positive from a risk/reward standpoint.
Charts courtesy of Trading View


