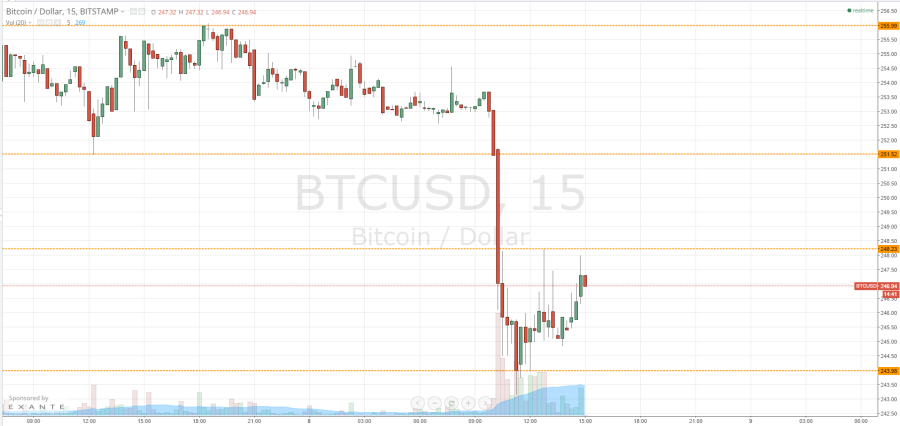
Early this morning we published our twice-daily technical analysis piece, highlighting the levels that we were watching as far as forming a bias was concerned, and suggesting what price reaching these levels would infer about action throughout the day. We’ve seen some sharp movement in the bitcoin price throughout the European session, and now a fresh set of key levels have become the ones to keep an eye on as we head into the US afternoon session and beyond. With this said, what are we looking at in the bitcoin price, and at which levels are we looking to enter? Take a quick look at the chart.
The chart illustrates the sharp decline seen shortly after we published this morning’s piece, breaking through what we had slated as in term support at 251.5 to reach our initial downside target. We found a floor around 243 flat, and since corrected to swing highs of 248.23, just ahead of where we now trade around 245 flat. Aforementioned swing highs serve as in term resistance, and 243.98 serves as in term support heading forward, medium-term. So, if we return to the overarching bearish momentum and get a break below 243.98, will be looking to enter short towards 240 flat, with a stop loss just ahead of 245 ensuring our risk profile remains positive.
Conversely, if we see a break above 248.23, we will reverse our initial bearish bias and enter towards a medium-term target of aforementioned broken support at 251.52. Bear in mind that this latter of the two is – given current momentum – more unlikely, so a stop around 247.5 would keep risk tight in the event of a return to the current trend and bearish momentum.
It’s volatile out there, so keep stops tight to make sure you don’t find yourself on the wrong end of a steep movement.
Charts courtesy of Trading View