Reason to trust

How Our News is Made
Strict editorial policy that focuses on accuracy, relevance, and impartiality
Ad discliamer
Morbi pretium leo et nisl aliquam mollis. Quisque arcu lorem, ultricies quis pellentesque nec, ullamcorper eu odio.
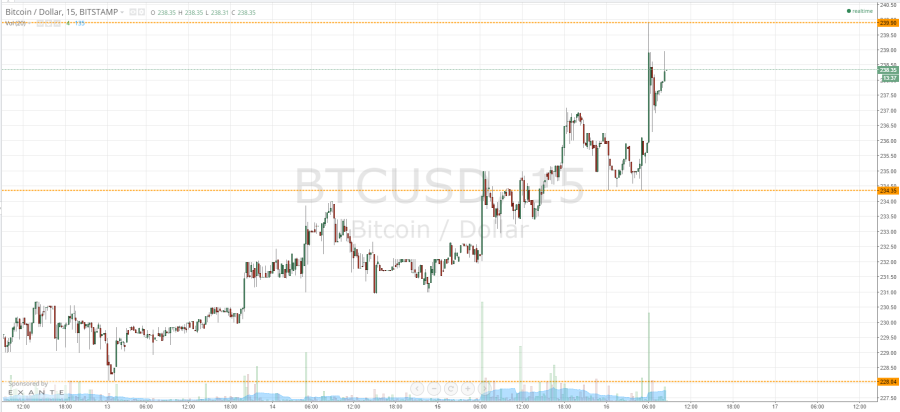
Shortly before the markets closed in the UK yesterday afternoon, we published our twice-daily bitcoin price watch piece. In the piece, we suggested how we would approach the markets throughout the Asian session, on expectations that markets and volatility and be able to implement our breakout strategy overnight. As it happened, we did get this volatility, and managed to get in and out of the markets pretty cleanly. So, with this said, what are the levels that we are watching today, and how we going to respond to any further volatility in the bitcoin price as business kicks off in Europe? Take a quick look at the chart.
As the chart shows, we got some bullish momentum throughout the night, and – a little earlier this morning – saw a kick in the bitcoin price to reach what now serves as in term resistance at 239.90. This is the level to watch to the upside this morning. To the downside, we are looking at 234.35 as in term support.
We will initially look for a break above aforementioned in term resistance (239.90) to validate a medium-term bullish bias with a primary upside target around 245 flat. On this trade, a stop loss somewhere around 237 flat will maintain a positive risk reward profile while taking us out of the trade in the event that we get a reversal and return to trade within the range we have already outlined.
Looking the other way, if we can get a break down below in term support, it would put us short towards an immediate downside target of 228.04 – weekly lows and a level that could serve as key as we head into the latter half of this week. Once again, a stop loss is necessary to keep control of our risk exposure, so somewhere around 237 flat should do the trick.
Charts courtesy of Trading View


Since 245 was broken, I’ll be interested to see what you think will happen next.