Reason to trust

How Our News is Made
Strict editorial policy that focuses on accuracy, relevance, and impartiality
Ad discliamer
Morbi pretium leo et nisl aliquam mollis. Quisque arcu lorem, ultricies quis pellentesque nec, ullamcorper eu odio.
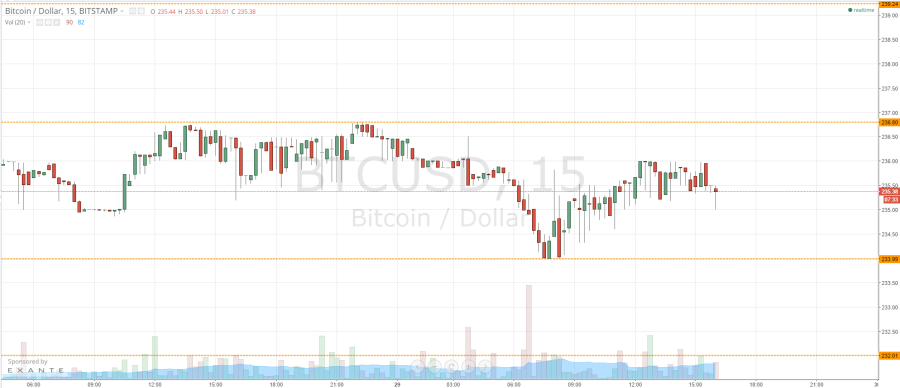
Earlier this morning, we published our twice-daily bitcoin price watch piece. In the piece we highlighted the levels that we would be keeping an eye on in the bitcoin price throughout Friday’s session, and suggested how we might respond to price reaching and breaking these levels as far as getting into a long or short position was concerned. Now action has matured throughout the day, what are the levels that we are looking at now, and what will we be playing for as we head into the weekend? Take a quick look at the chart.
One of the things we mentioned this morning, and it’s worth mentioning again, is that action has been relatively flat for the majority of the week. This has led to relatively little opportunities far as trading breakouts is concerned, and with the price range so tight, it has made it difficult to enter any really aggressive range bound trades. However, this has not been totally impossible, and we have drawn a profit on a couple of occasions over the last few days (as well as being stopped out too!). So, this said, and with today’s continuing flat action, the levels that we are watching as we head into the weekend remain exactly the same as those which we pointed out earlier on this morning. In term support at was at 233.9 and remains so, and resistance at 236.8 continues to hold.
We are currently trading mid-range, and will look for a run up towards 236.80 (and a close above this level on the intraday chart) to validate an initial upside target exactly the same as this morning at 239.24. Once again, a stop loss around 235.5 presents us with an attractive risk to reward profile. To the downside, a break below 233.99 would bring 232.01 into play medium-term with a stop around the same level as that of the long trade valid.
Charts courtesy of Trading View


