
Reason to trust
How Our News is Made
Strict editorial policy that focuses on accuracy, relevance, and impartiality
Ad discliamer
Morbi pretium leo et nisl aliquam mollis. Quisque arcu lorem, ultricies quis pellentesque nec, ullamcorper eu odio.
Bitcoin price is moving lower below the $30,500 pivot level. BTC could decline heavily if there is a close below the $29,800 support zone in the near term.
- Bitcoin is moving lower below the $30,500 support zone.
- The price is trading below $30,500 and the 100 hourly Simple moving average.
- There was a break below a contracting triangle with support near $30,200 on the hourly chart of the BTC/USD pair (data feed from Kraken).
- The pair could extend its decline if it stays below $31,200 for a long time.
Bitcoin Price Shows Bearish Signs
Bitcoin price moved into the red zone after it broke the $30,500 support zone. BTC traded below the $30,000 level but the downsides were limited.
The price seems to be trading in a range above the $29,850 support zone. There was a move above the 23.6% Fib retracement level of the downward move from the $31,630 swing high to the $29,868 low. The price even attempted a fresh increase above the $30,500 resistance but failed.
Bitcoin is now trading below $30,500 and the 100 hourly Simple moving average. There was also a break below a contracting triangle with support near $30,200 on the hourly chart of the BTC/USD pair.
If there is another increase, the price might face resistance near the $30,300 level and the 100 hourly Simple moving average. The next resistance is near the $30,500 zone, above which the price might retest $30,750. It is close to the 50% Fib retracement level of the downward move from the $31,630 swing high to the $29,868 low.
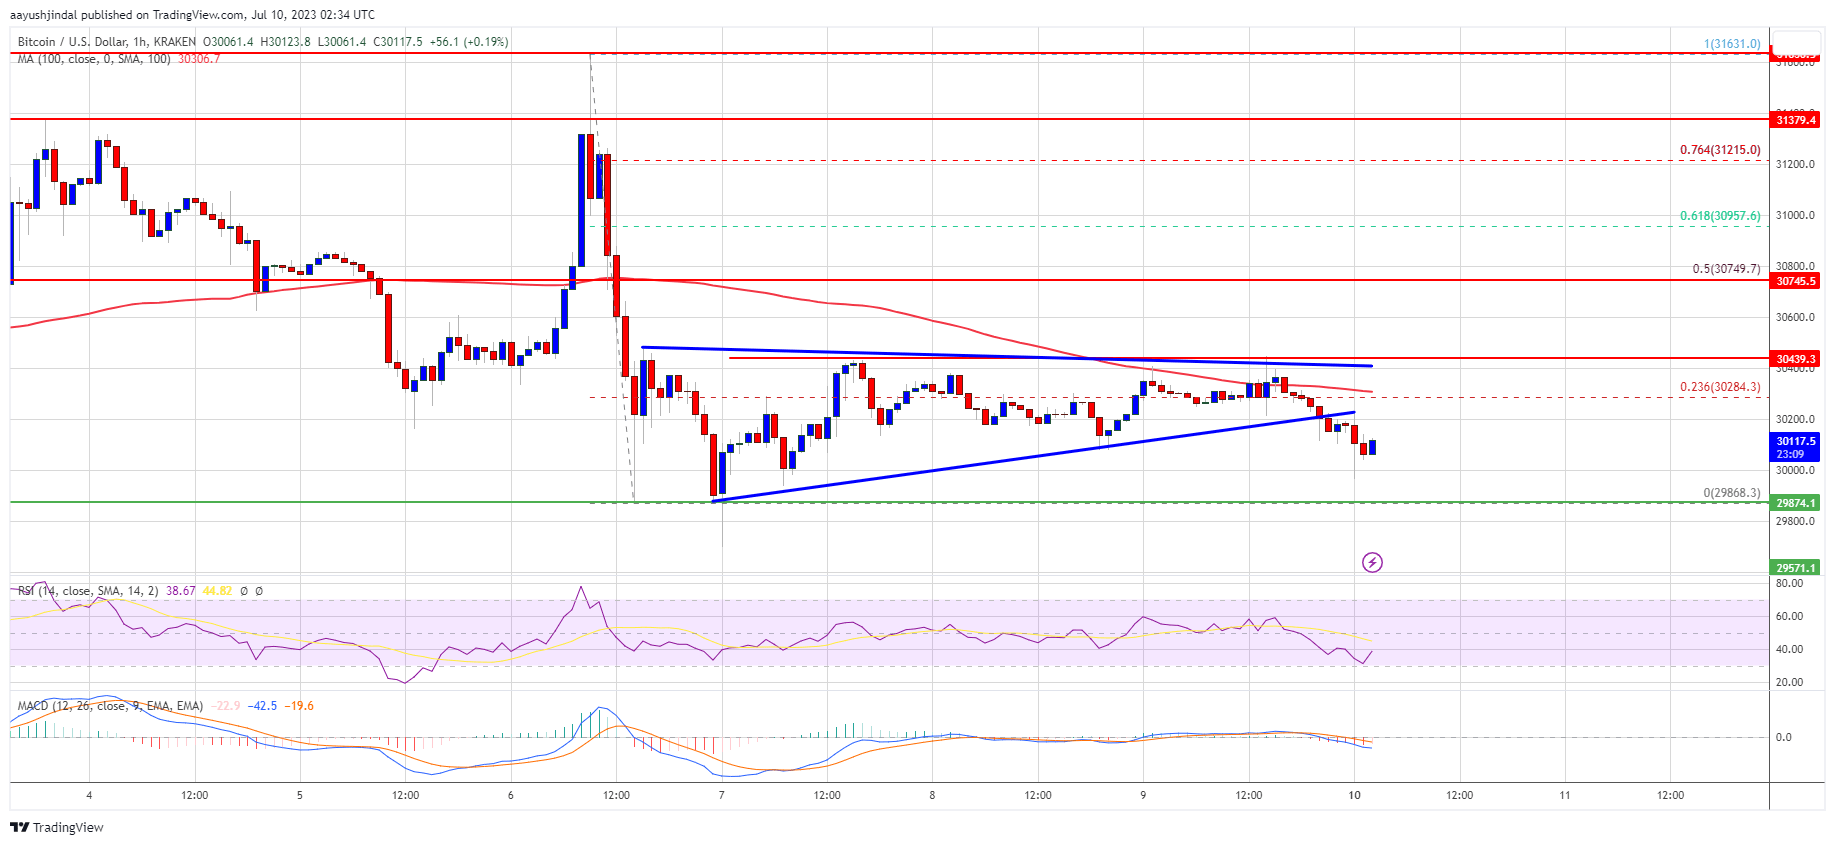
Source: BTCUSD on TradingView.com
If the bulls push the price above the $30,750 level, there could be a drift toward $31,000. The next major resistance is near the $31,400 level. Any more gains could open the doors for a move toward the $32,000 resistance zone.
More Losses in BTC?
If Bitcoin’s price fails to clear the $30,300 resistance, it could continue to move down. Immediate support on the downside is near the $30,000 level.
The next major support is near the $29,850 level, below which there could be a drop toward $29,400. Any more losses might send the price toward the $28,800 level.
Technical indicators:
Hourly MACD – The MACD is now gaining pace in the bearish zone.
Hourly RSI (Relative Strength Index) – The RSI for BTC/USD is now below the 50 level.
Major Support Levels – $29,850, followed by $29,400.
Major Resistance Levels – $30,300, $30,500, and $30,750.


