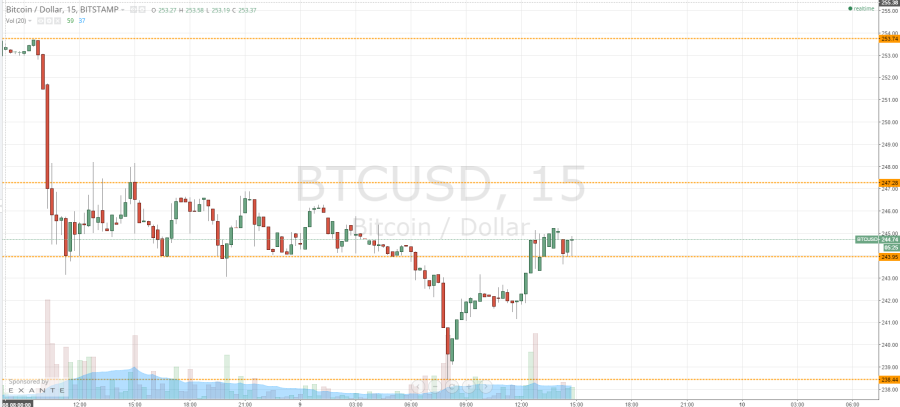
Shortly before the markets opened this morning for the European session, we published a piece highlighting action in the bitcoin price during the US afternoon the previous day and overnight on Wednesday. Action has now matured throughout the European session, and we have seen a large amount of volatility throughout the day. This said, what are our analysts looking at now, and what levels will we be watching as we head into the US afternoon and throughout Thursday night in order to offer up our intraday bias? Take a quick look at the chart.
Earlier this morning, we covered the sharp decline we saw in the bitcoin price as it broke out of Wednesday’s range, and noted the floor at 238.44 as a possible reversal point. We suggested a break below this level would validate a bearish bias, or a run towards in term resistance at 243.95 – and the subsequent break above – would switch this bias to the upside. The latter of these two scenarios has occurred, putting our medium-term bias as a bullish one.
We also suggested that an entry at current levels this morning (somewhere around 240 with an initial upside target towards 243.95) could be an aggressive long entry, one that will have paid off for any aggressive readers. So now, we have in term support at 243.95, and resistance at 247.28. These are the levels to keep an eye on as we head into the coming few hours. A nice quick profitable trade could be an entry at current levels with a stop somewhere around 243 flat, and an initial upside target of 247.28. We’ll be looking for a break above this level to validate 250 flat medium-term, and – slightly longer-term – 253.74.
Conversely, if we break back down below current support at 243.95, it would validate the aforementioned floor medium-term to the downside, with a stop loss on a short trade somewhere around 245 flat ensuring we are taken out for a small loss in the event of a bias reversal.
Charts courtesy of Trading View