Reason to trust

How Our News is Made
Strict editorial policy that focuses on accuracy, relevance, and impartiality
Ad discliamer
Morbi pretium leo et nisl aliquam mollis. Quisque arcu lorem, ultricies quis pellentesque nec, ullamcorper eu odio.
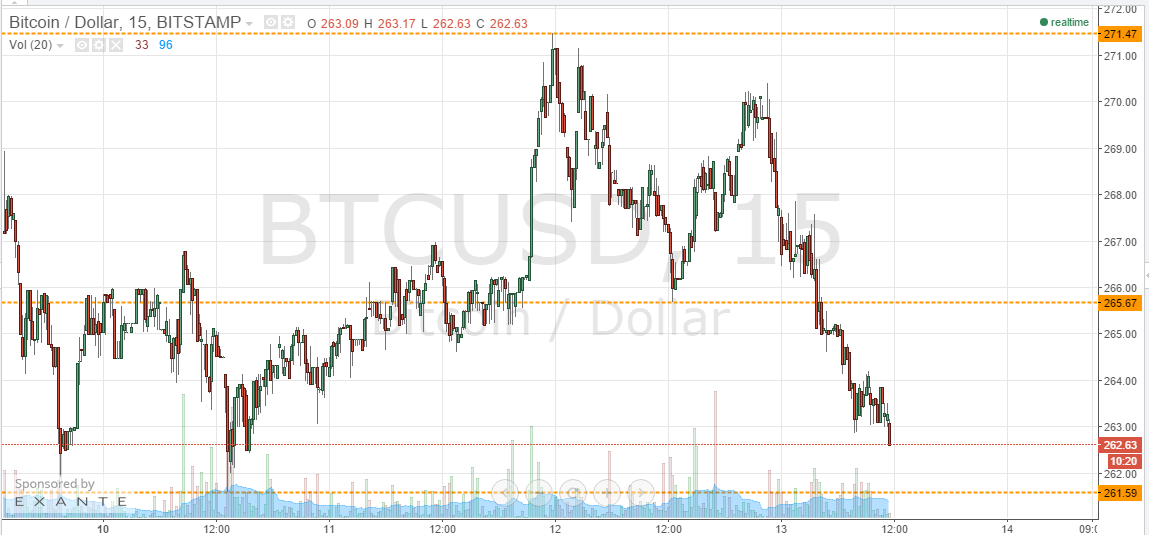
Late yesterday evening, we published our twice-daily bitcoin price watch piece. In the piece, we highlighted the levels that we were watching throughout the Asian session on Wednesday evening, and suggested how we would respond to price reaching these levels as far as getting in according to our intraday bitcoin price watch strategy was concerned. Now action has matured overnight, what are the levels that we are keeping an eye on in the bitcoin price today, and is there further profit to be drawn from either our intraday breakout strategy or our scalping strategy or an intra-range method? Take a quick look at the chart.

As you see, overnight action marked a return to the volatility we saw over the weekend in the bitcoin price. Overnight, we broke through 265.67, and are now trading mid-range between the aforementioned level (which serves as in term resistance) and in term support at 261.59. These are the two levels that we will be keeping an eye on during today’s session.
We will first look for a break below 261.59 (since this falls in line with the overarching bearish momentum) to validate a medium-term downside target of 255 flat. On this trade, a stop loss somewhere around 263 will help us to maintain a positive risk reward profile, while leaving enough room for us to chop back into the range without being taken out.
Looking the other way, a break back above 265.67 would validate 271.47 (weekly highs) as a longer-term upside target. Bear in mind, 270 flat will likely offer up some level of resistance before we reach our target here, so keep visiting consideration – the more risk averse trader might choose to use the aforementioned 270 as a near-term target before looking longer. A stop loss again around 263 will keep things tight from a risk management perspective on this trade.
Charts courtesy of Trading View


So much for the asset of the age huh?
Good Day Samuel,
Like your analysis & articles… <3
So what would you think about the price of the BitCoin (going up or down?) if there is a collapse of US Dollars?
Thanks for Sharing…
Sincerely,
david
It is a corrective and consolidation wave, which is to be expected in a normal supply and demand market. As the MACD crossover suggests, a collapse to 255 is expected to resolve the downward curve of the wave and create momentum for the upswing.
It looks like it is happening more correctly on OKCoin according to our TA expectations. Both Bitstamp and BitFinex are not following the trend, for some unknown reason.
If the wave does not resolve, then we could be stuck in this (sideways) bear pennant for a long time!
You sound like one of those tarot readers.
Honestly the analysis on any market especially as volatile as bitcoin is akin to reading coffee stains in a cup.