
Reason to trust
How Our News is Made
Strict editorial policy that focuses on accuracy, relevance, and impartiality
Ad discliamer
Morbi pretium leo et nisl aliquam mollis. Quisque arcu lorem, ultricies quis pellentesque nec, ullamcorper eu odio.
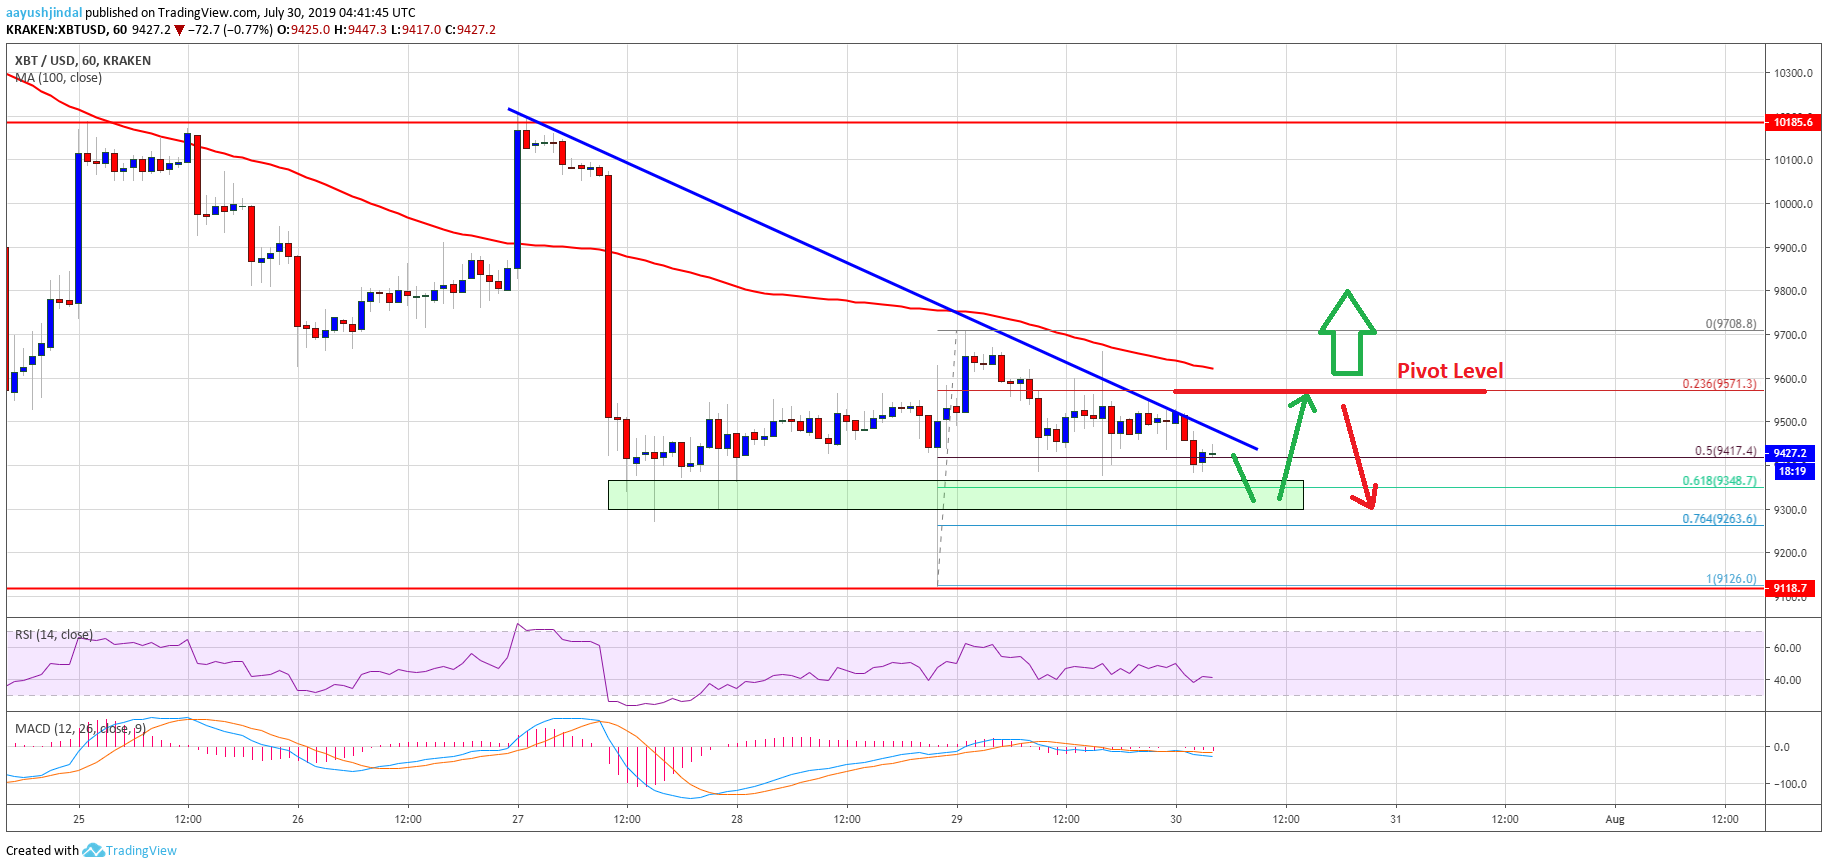
- Bitcoin price is currently consolidating above the key $9,300 support area against the US Dollar.
- The price is facing a few key resistances near the $9,500, $9,600 and $9,650 levels.
- There is a connecting bearish trend line forming with resistance near $9,500 on the hourly chart of the BTC/USD pair (data feed from Kraken).
- The price start a decent recovery as long as there is no downside break below the $9,300 support.
After bearish moves, bitcoin price started consolidating above $9,300 against the US Dollar. However, BTC must gain momentum above $9,650 to start an upward move.
Bitcoin Price Analysis
After a sharp decline, bitcoin price found support near the $9,120 level against the US Dollar. The BTC/USD pair traded as low as $9,126 and recovered above the $9,300 and $9,500 levels. Additionally, the pair climbed above $9,600, but it struggled to surpass the $9,700 resistance. More importantly, there was no break above the 100 hourly simple moving average (similar to Ethereum and ripple), which is currently near $9,650.
The price topped near the $9,708 level and recently corrected lower. It broke the $9,600 support level plus the 23.6% Fib retracement level of the upside move from the $9,126 low to $9,708 high. Moreover, the price traded below the $9,500 level, but the $9,400 area seems to be acting as a decent support. The 50% Fib retracement level of the upside move from the $9,126 low to $9,708 high is also acting as a support.
The main support is near the $9,300 area. Therefore, a downside break and close below the $9,300 support might push the price further lower. The next support is near $9,125, below which there is a risk of more losses below the $9,000 handle.
On the upside, there are many hurdles near the $9,500, $9,600 and $9,650 levels. Additionally, there is a connecting bearish trend line forming with resistance near $9,500 on the hourly chart of the BTC/USD pair. The key resistance is near the $9,650 level and the 100 hourly SMA. If there is a successful break above $9,600 and a follow through above $9,700, the price could start a solid upward move.
Looking at the chart, bitcoin price is likely to start a slow and steady recovery above $9,600 and $9,700 as long as there is no bearish break below the $9,300 support level. In the bullish scenario, the price may perhaps recover towards the $10,000 and $10,200 resistance levels.
Technical indicators:
Hourly MACD – The MACD is still placed in the bearish zone.
Hourly RSI (Relative Strength Index) – The RSI for BTC/USD is currently well below the 50 level, with bearish signs.
Major Support Levels – $9,300 followed by $9,125.
Major Resistance Levels – $9,500, $9,650 and $9,700.


